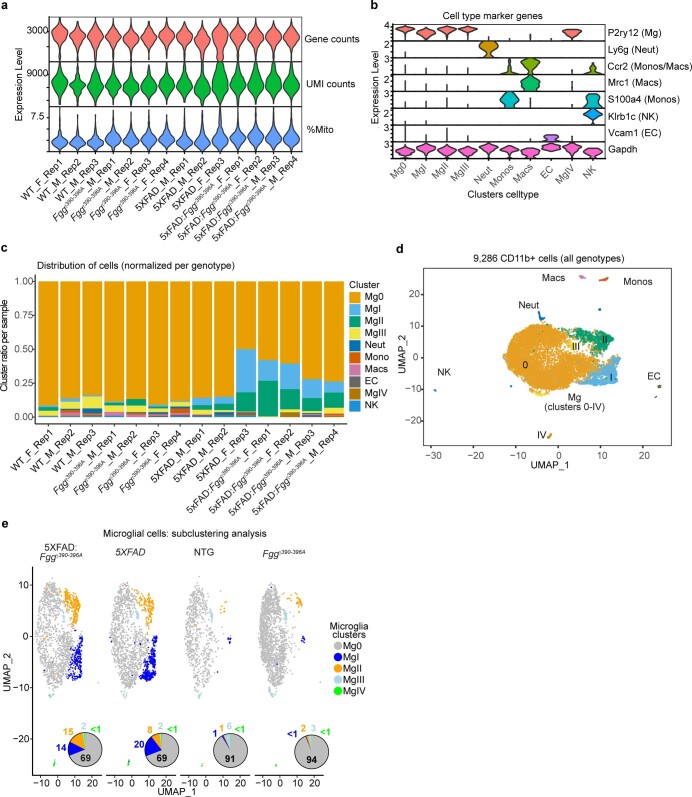
Extended Data Fig. 9. Quality control for scRNA-seq data related to Fig. 7.
a, Violin plots of gene counts, UMI counts, and %mito for each biologically independent sample. F, female; M, male. b, Violin plots of cell type marker genes used to annotate each cluster. c, Cluster ratio per biological replicate. d, UMAP plot of all single CD11b+ cells identified by clustering analysis (n = 9,286 cells from brains of three 5XFAD, three NTG, four 5XFAD:Fggγ390-396A, and four Fggγ390-396A mice). e, UMAP plots of microglial cells subclustering analysis split by genotype. Ven diagrams depict percentage of cells per cluster.

