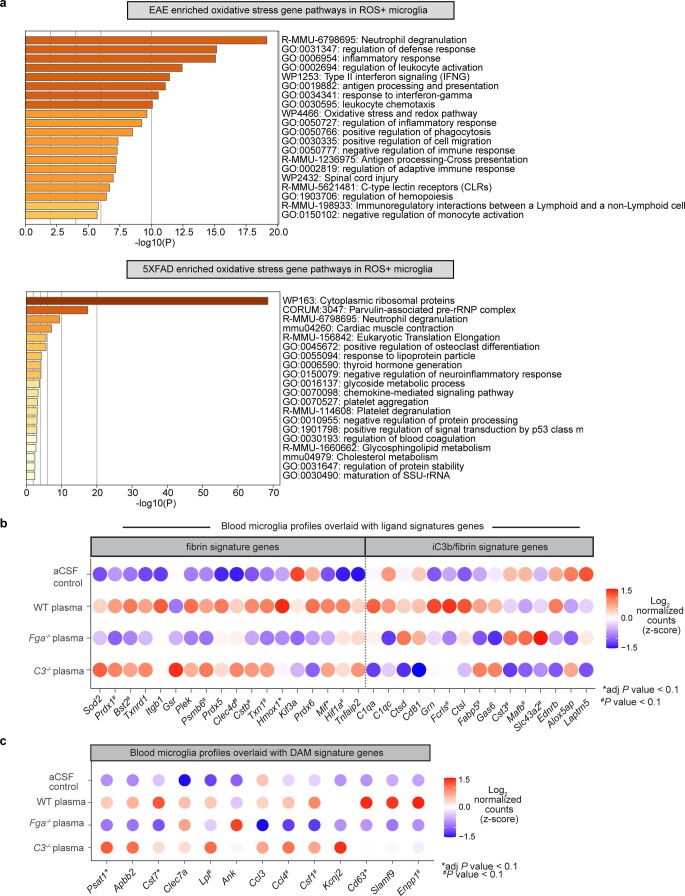
Extended Data Fig. 10. Pathway analysis of unique microglia oxidative stress gene signatures and gene signature overlays.
a, Metascape analysis showing the top significant gene pathways shared in ROS+ microglia from EAE (top) and 5XFAD (bottom) mice. Data correspond to gene signatures in Fig. 8b. P values calculated by hypergeometric test without multiple test correction. b, c, Dot plot of microglia gene expression from plasma or control injected brains overlaid with microglia fibrin and iC3b/fibrin activation signature genes (b) or in vivo DAM signature (c). Data points represent the average of n = 3 - 4 biological replicates per group. Two mice were pooled per replicate. Significance determined by Wald test following by BH test correction.

