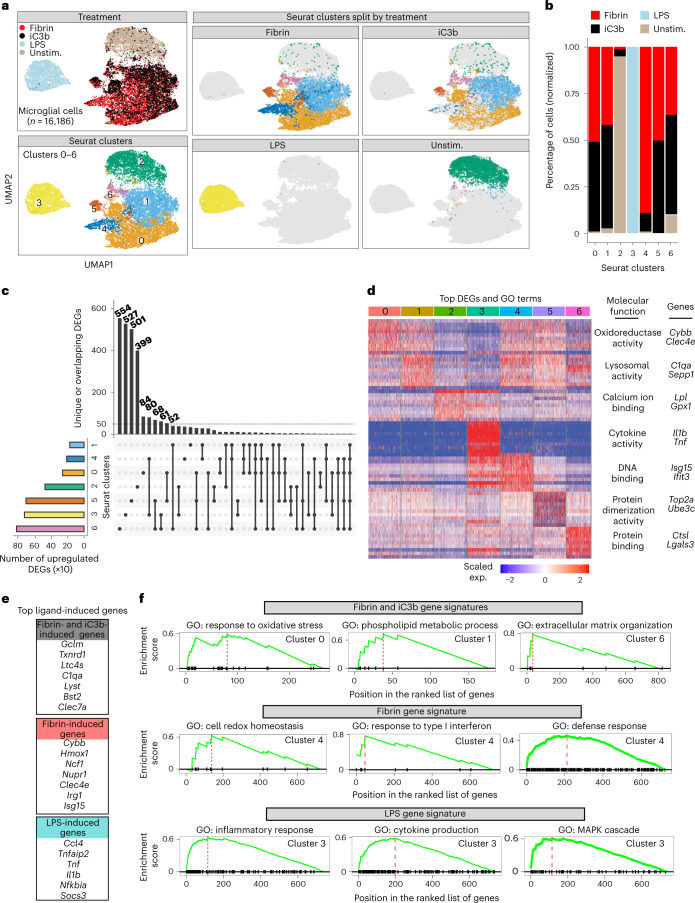
Fig. 2. scRNA-seq analysis of ligand-selective activation of microglia.
a, UMAP plots of single microglial cells treated with fibrin, iC3b and LPS identified by unsupervised clustering analysis (n = 16,196 cells from two independent experiments). b, Fractions of cells in each Seurat cluster colored based on treatment label. c, UpSet plot showing a matrix layout of DEGs specific to a cluster (single filled circle with no vertical lines) and DEGs shared between clusters (filled circles connected with vertical lines). Vertical bar plot of the unique or overlapping DEGs in clusters (top). Horizontal bar plot of the number of upregulated DEGs for a cluster (left). d, Heat map of top ten DEGs per single-cell cluster. Example GO molecular function terms and genes for a given cluster are shown. Five-hundred cells (maximum) were randomly selected from each cluster, as shown in a, for visualization. Gene expression is depicted as log-normalized scaled expression. e, List of selected top upregulated ligand-induced genes. f, GSEA plots of top GO terms for ligand-induced gene signatures. Adjusted P < 0.05 by Kolmogorov–Smirnov test with BH test correction. Exp., expression; unstim., unstimulated.

