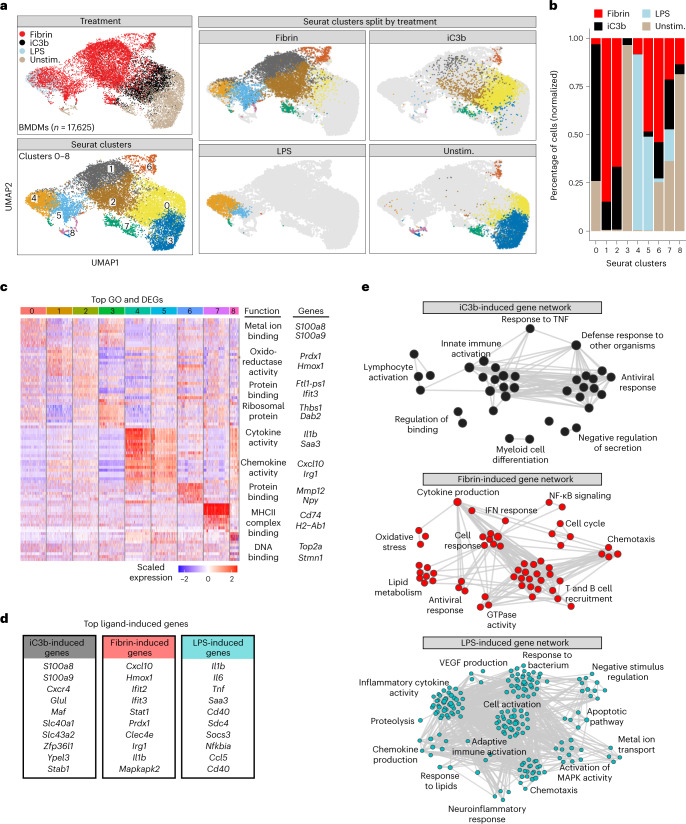
Fig. 3. Single-cell RNA-seq analysis of ligand-selective activation of macrophages.
a, UMAP plots of single BMDMs treated with fibrin, iC3b or LPS identified by unsupervised clustering analysis (n = 17,625 cells from six mice (fibrin), two mice (iC3b), four mice (LPS) and eight mice (unstimulated)). BMDMs are shown colored by treatment, Seurat cluster or both. b, Fraction of cells in each Seurat cluster colored based on treatment label. c, Heat map of top ten DEGs per single-cell cluster. Example GO molecular function terms and genes for a given cluster are shown. Five-hundred cells (maximum) were randomly selected from each cluster, as shown in a, for visualization. Gene expression is depicted as log-normalized scaled expression. d, List of selected top upregulated ligand-induced genes. e, Coexpression GO term networks for iC3b (black-filled nodes), fibrin (red-filled nodes) and LPS (cyan-filled nodes) from scRNA-seq of BMDMs. Upregulated GO terms are shown as colored nodes, and gene coexpression overlap is shown as gray edges. P < 0.10 (fibrin and iC3b) and P < 0.01 (LPS) by GSEA Kolmogorov–Smirnov test without multiple test correction.

