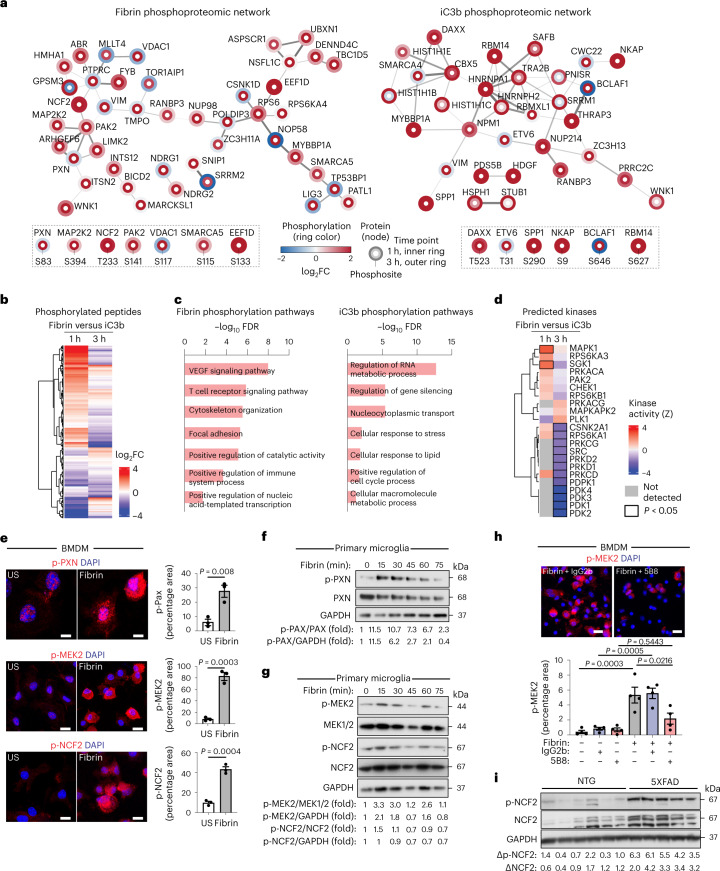
Fig. 4. Phosphoproteomics of fibrin and iC3b signaling in innate immune cells.
a, Phosphoproteomic interaction networks for fibrin and iC3b. Selected phosphopeptides shown with phosphorylation as blue–red scheme and time points as rings. Adjusted P < 0.05. b, DEPs between fibrin and iC3b at each time point. c, Functional enrichment terms from fibrin or iC3b phosphorylation pathways. d, Kinase activities from the phosphoproteomic dataset. Differentially regulated kinases between fibrin and iC3b are indicated with black bounding. Kinases below the cutoff are in gray. e, Confocal microscopy and quantification of p-MEK2, p-PXN and p-NCF2 staining in BMDMs stimulated with fibrin or unstimulated (US). f,g, Immunoblot of p-PXN, PXN and GAPDH (f) and p-MEK2, MEK1/2, p-NCF2 and GAPDH (g) in primary rat microglia, US or stimulated with fibrin; FC compared with control is indicated. h, Microscopy and quantification of p-MEK2 staining in BMDMs left US or stimulated for 90 min with fibrin alone or in the presence of 5B8 or IgG2b. i, Immunoblot of p-NCF2, NCF2 and GAPDH from 12-month-old 5XFAD or NTG mouse cortex. Signal ratios (delta) for p-NCF2–GAPDH and NCF2–GAPDH are shown. Data are from n = 2 (fibrin 1 h), n = 2 (iC3b 1 h), n = 3 (US 1 h), n = 3 (fibrin 3 h), n = 3 (iC3b 3 h) and n = 3 (US 3 h) independent experiments (a–d); n = 3 independent experiments in duplicate (e), representative of two independent experiments (f,g); n = 4 independent experiments in duplicates (h); or n = 6 (NTG) and n = 5 (5XFAD) mice (i). Statistics: two-sided Student’s t test with BH test correction (a and b), FDR < 0.05 by hypergeometric test with BH correction (c), P < 0.05 by two-sided z test (d), two-tailed unpaired t test (e) or one-way ANOVA with Tukey’s multiple comparisons test (h). Data are mean ± s.e.m., and nuclei are labeled with DAPI (e and h). Scale bars, 10 μm (e); 50 μm (h). US, unstimulated.

