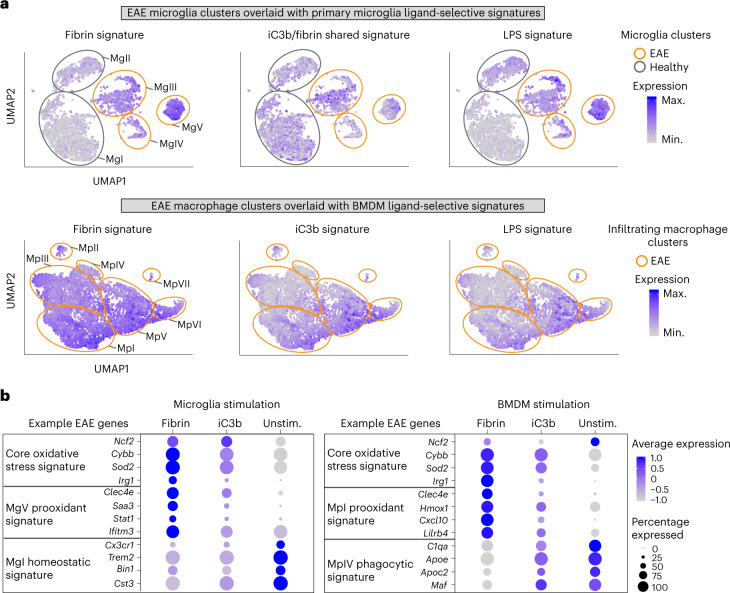
Fig. 5. Unbiased overlay of ligand-selective gene signatures with innate immune cell subsets in EAE.
a, UMAP of EAE microglia or macrophage Tox-seq clusters31 overlaid with primary microglia (top) or BMDM (bottom) ligand-activation signatures (this study). Expression is depicted as a log-normalized average modular score for each signature. CNS innate immune cell clusters are numerically labeled and outlined to depict healthy and EAE samples (gray and orange, respectively). b, Dot plot of selected gene markers across the scRNA-seq datasets of primary microglia (left panel) and BMDMs (right panel) unstimulated or stimulated with fibrin or iC3b. Average gene expression is depicted as scaled log-normalized expression. Max., maximum; min., minimum.

