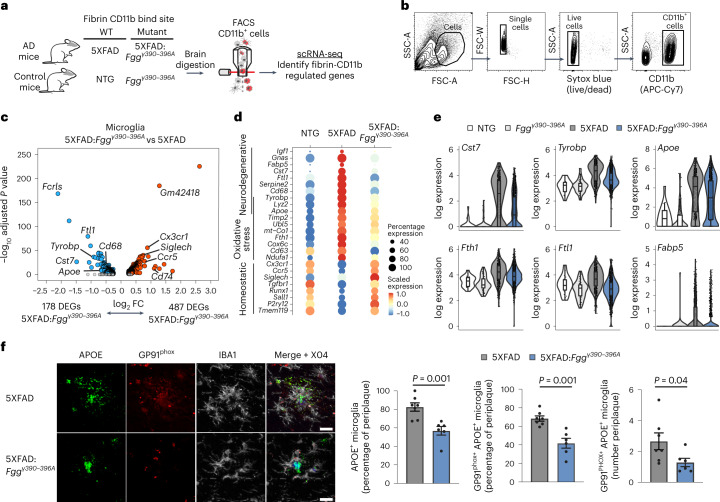
Fig. 7. Fibrin induces a neurodegenerative gene signature via CD11b receptor in 5XFAD mice.
a, Schematic of scRNA-seq analysis of 5XFAD, 5XFAD:Fggγ390–396A and control mice. b, Gating strategy for brain CD11b+ scRNA-seq analysis in mice. c, Volcano plot of DEGs in microglia (clusters 1 and 2) between 5XFAD:Fggγ390–396A and 5XFAD mice. Dots depict average log2 FC and −log10 adjusted P values (log2 FC > 0.25, adjusted P < 0.05 with MAST test and BH correction). Data points represent the average of n = 3 mice (5XFAD) and n = 4 mice (5XFAD:Fggγ390–39 6A). d, Dot plots of microglia neurodegenerative, oxidative stress and homeostatic gene signatures in NTG, 5XFAD and 5XFAD:Fggγ390–396A mice. Dot size and color indicate percentage of cells expressing a gene and average expression level, respectively. Data points are averages of n = 3 mice (5XFAD) and n = 4 mice (5XFAD:Fggγ390–396A). e, Violin plots of log expression levels of microglia genes Cst7, Tyrobp, Apoe, Fth1, Ftl1 and Fabp5 across genotypes. Violin plots depict minimum, maximum and median expression, with points showing single-cell expression levels. Box plots show the first to third quartiles (25–75% box bounds) with median values indicated and upper and lower whiskers extending to 1.5× interquartile range. Data are from single cells of n = 3 mice (NTG), n = 4 mice (Fggγ390–396A), n = 3 mice (5XFAD) or n = 4 mice (5XFAD:Fggγ390–396A). f, Confocal microscopy images of brain sections from 12-month-old 5XFAD:Fggγ390–396A and 5XFAD mice immunostained for oxidative stress (GP91phox), microglia (IBA1), DAM (APOE) and plaque (Methoxy-X04) markers. Image quantification is shown from n = 6 mice (5XFAD:Fggγ390–396A) and n = 7 mice (5XFAD). Data are shown as mean ± s.e.m. P < 0.05 by two-tailed Mann–Whitney U test. Scale bar, 10 μm.

