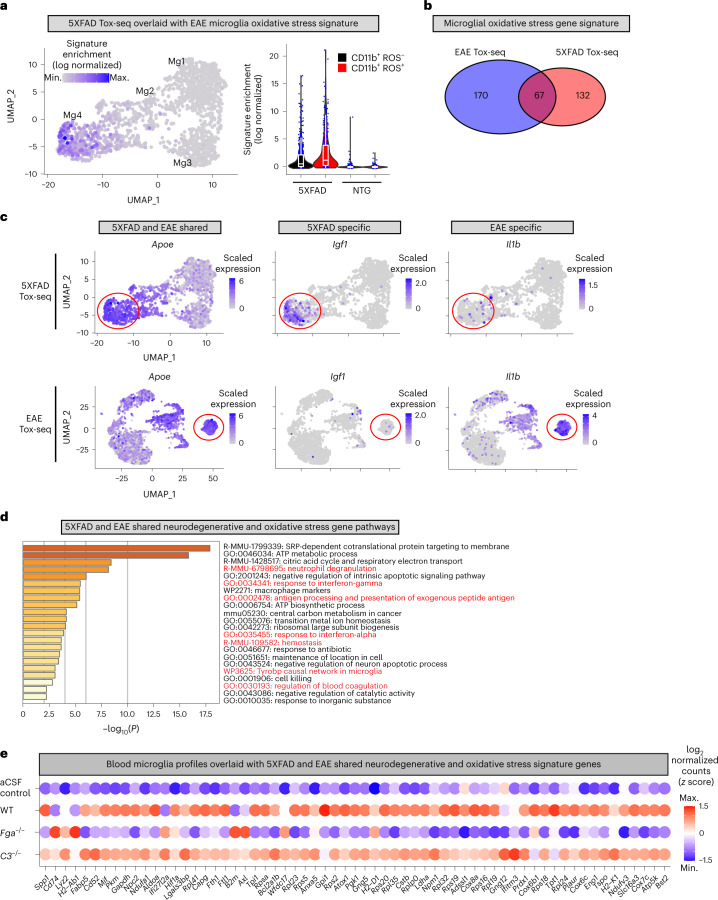
Fig. 8. Comparison of microglial oxidative stress signature induced by neurodegeneration and autoimmunity.
a, UMAP plot of 5XFAD Tox-seq clusters overlaid with EAE microglial oxidative stress genes signature (left). Violin plots of EAE oxidative stress signature enrichment in 5XFAD and NTG mice (right); n = 1,579 cells from brains of three 5XFAD and three NTG mice. Violin plots depict minimum, maximum and median expression, with points showing single-cell expression levels. Box plots show the first to third quartiles (25–75% box bounds) with median values indicated and upper and lower whiskers extending to 1.5× interquartile range. b, Venn diagram of oxidative stress genes in CD11b+ ROS+ microglia from 5XFAD or EAE. c, UMAP plots of shared and unique oxidative stress microglia genes in 5XFAD and EAE. Gene expression overlays for Apoe, Igf1 and Il1b are shown. Gene expression is depicted as log-normalized scaled expression. The red outline demarcates microglial cells in a ROS-enriched cluster. Representative genes shared between or specific to 5XFAD and EAE Tox-seq are shown. d, Metascape analysis of top significant gene pathways shared in ROS+ microglia from 5XFAD and EAE mice. e, Dot plot of gene expression from blood microglia profiles overlaid with the 5XFAD and EAE shared oxidative stress gene signature in microglia as shown in b.

