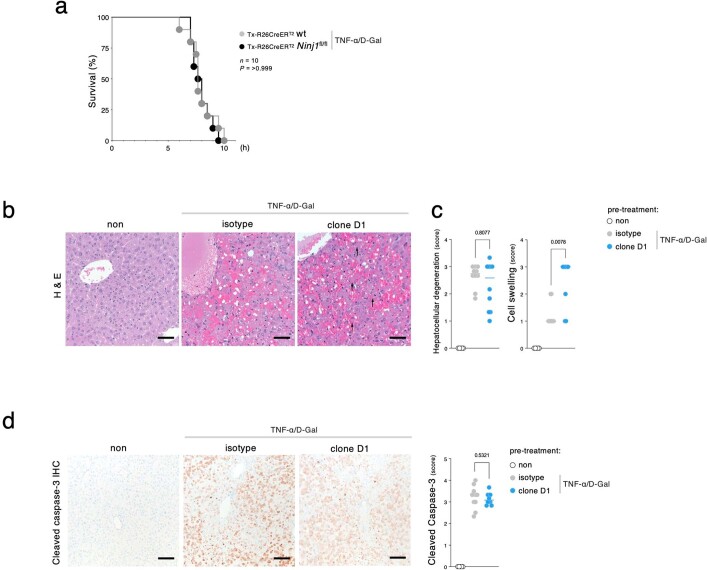
Extended Data Fig. 6. Impact of clone D1 pretreatment on hepatocellular degeneration and caspase-3 cleavage in mice treated with TNF plus D-Gal.
a, Kaplan–Meier survival plots of mice injected with 25 μg kg−1 TNF plus D-Gal. n = 10 mice per group. P value two-tailed log-rank test. Results representative of 3 independent experiments. b, Representative haematoxylin and eosin-stained liver sections of the mice in Fig. 4e. Scale bar, 50 µm. Arrows indicate swollen cells. c, Histological scores of hepatocellular degeneration (left) and liver cell swelling (right) for the mice in Fig. 4e. Untreated wild-type, n = 5 mice; wild-type dosed with antibody, TNF plus D-Gal, n = 10 (left), n = 9 (right) mice. Lines represent the median, circles individual mice. P value two-tailed Mann-Whitney U-test. d, Liver sections from the mice in Fig. 4e after immunolabeling of cleaved caspase-3 (brown). Graph indicates qualitative scoring of cleaved caspase-3 labeling. Untreated wild-type, n = 5 mice; wild-type dosed with isotype control antibody, TNF plus D-Gal, n = 10 mice; Wild-type dosed with clone D1 and TNF plus D-Gal, n = 10 mice. Lines represent the median, circles individual mice. P value two-tailed Mann-Whitney U-test. Scale bar, 100 µm.

