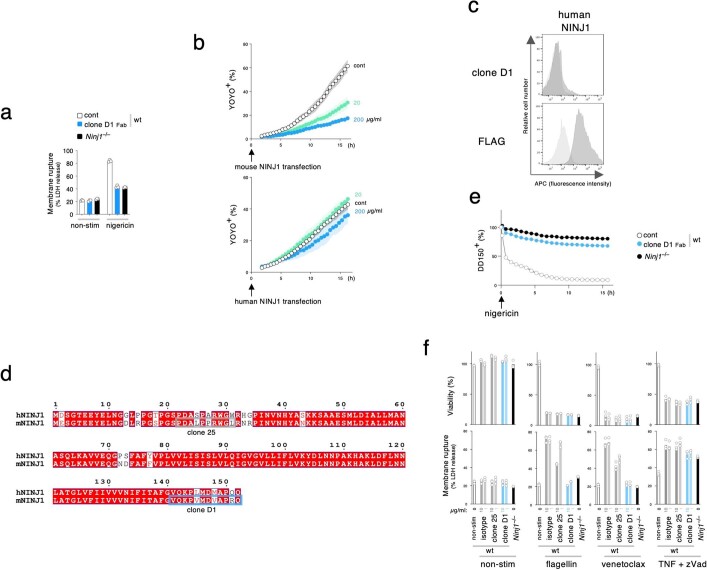
Extended Data Fig. 1. Clone D1 inhibits PMR.
a, Graphs indicate LDH release in cultures of wild-type BMDMs after priming, and then stimulation with nigericin for 16 h in the presence or absence (cont) of clone D1 Fab. Non-stim, non-stimulated control. Bars indicate the mean. Circles indicate 3 biological replicates. Results representative of 3 independent experiments. b, Graphs indicate the percentage of YOYO-1+ HEK293T NINJ1 expressing cells when cultured with or without (cont) clone D1 Fab. Circles are the mean ± s.d. (shaded area) of 3 independent replicates. Results are representative of 2 independent experiments. c, Flow cytometry histograms of propidium iodide-negative HEK293T cells surface-stained with anti-NINJ1 or anti-FLAG antibodies. Cells are mock transfected (light gray) or transfected with human NINJ1 (dark gray). Results representative of 3 independent experiments. d, Amino acid sequence alignment of human and mouse NINJ1. Predicted epitope of clone 25 (grey box) and clone D1 (blue box) are highlighted. e, Graph shows the release of DD-150 from Pam3CSK4-primed BMDMs in (a) after nigericin stimulation. Data are means (circles) ± s.d. (shaded area). Circles indicate 3 biological replicates (n = 3 animals). Results representative of 3 independent experiments. f, Graphs indicate cell viability (top) and LDH release (bottom) in BMDMs. Non-stim, non-stimulated control. Bars indicate the mean. Circles indicate 3 biological replicates (n = 3 animals). Results representative of 2 independent experiments.

