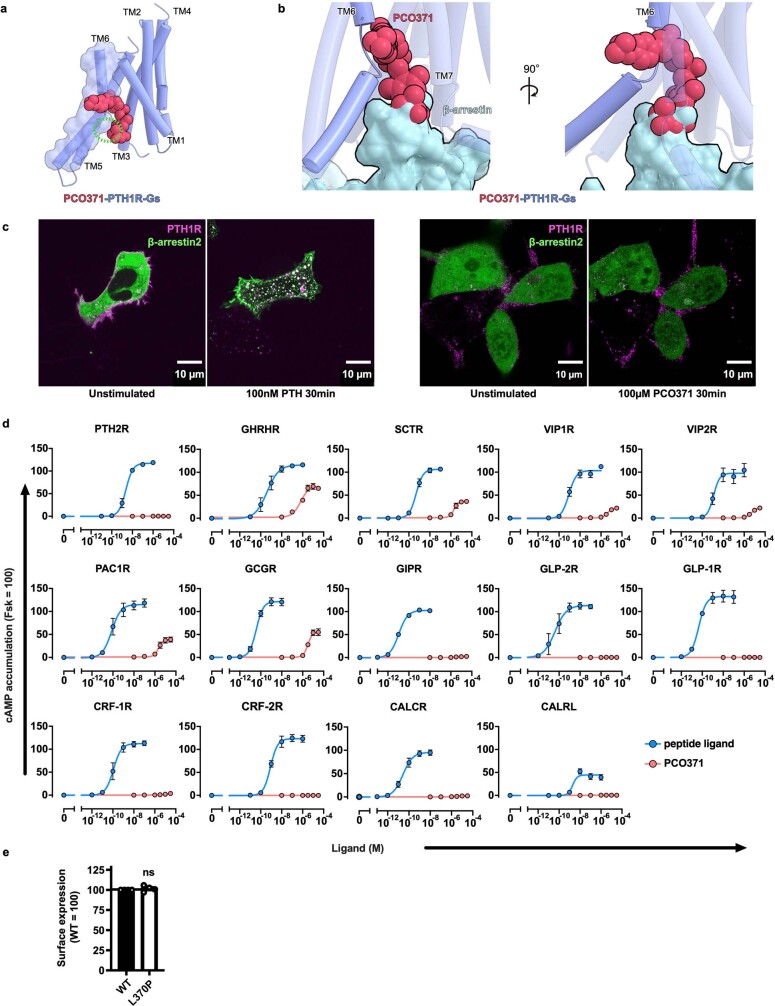
Extended Data Fig. 8. PCO371-induced activation of class B1 GPCRs.
(a) The TMD structures of PCO371-bound PTH1R (violet) and PCO371 (crimson) are shown parallel to the membrane. (b) Superimposed structures of PCO371–PTH1R–Gs and formoterol–β1AR–β-arrestin complexes, aligned on TMs 2-5. PCO371 facilitates the outward conformation of the intracellular portion of TM6 and clashes with β-arrestin. (c) Representative images of the cellular localization of Alexa-647-labeled PTH1R (magenta) and mVenus-fused β-arrestin 2 (green), related to Fig. 3g. These images obtained from 10-19 images of these experiments. (d) Concentration-response curves of the GloSensor cAMP response of 15 class B1 GPCRs upon endogenous peptide agonist (blue) or PCO371 (red) stimulation. The following endogenous peptide agonists were used for each GPCR; PTH (1–34), PTH2R: Growth hormone-releasing hormone, GHRHR; Secretin, SCTR; Pituitary Adenylate Cyclase Activating Polypeptide (PACAP, 1–27), VIP1R and VIP2R; PACAP (1–38), PAC1R; Glucagon, GCGR; Gastric Inhibitory Polypeptide, GIPR; Glucagon-like Peptide 2, GLP-2R; Glucagon-like Peptide 1, GLP-1R; Corticotropin Releasing Factor, CRF1R and CRF2R; Calcitonin, CALCR; Calcitonin Gene Related Peptide, CALRL. All peptides are human-derived sequence. Symbols and error bars represent mean and SEM, respectively, of three independent experiments with each performed in duplicate. (e) Cell surface expression of WT and mutant PTH2R assessed by the flow cytometry analysis. Symbols and error bars represent mean and SEM, respectively, and dots show individual data of four independent experiments, with each performed in duplicate. Statistical analysis was performed by two-tailed t-test. ns, not significantly different between the groups.

