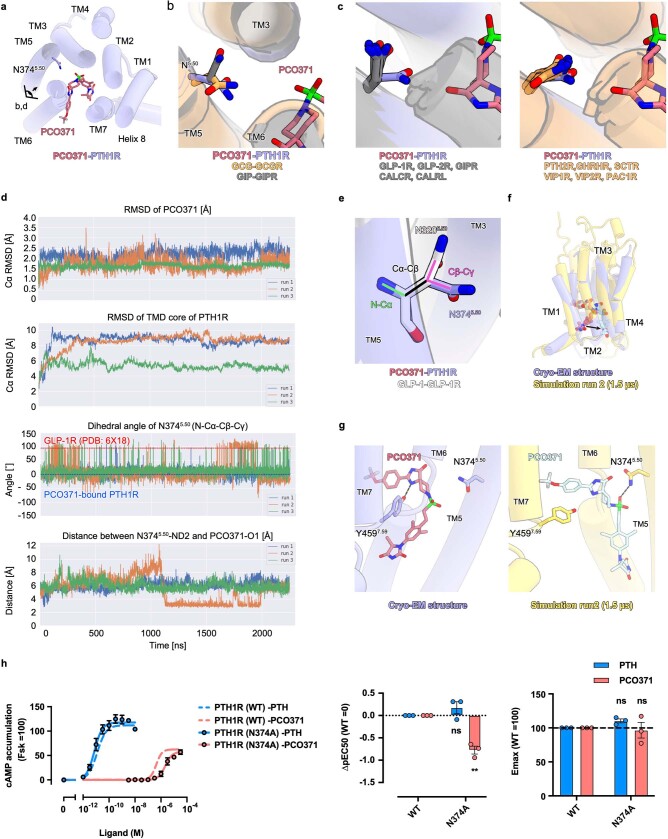
Extended Data Fig. 10. MD simulation from the PCO371-bound PTH1R.
(a) A cross-section view of the PCO371-bound PTH1R. (b) A magnified view of the superimposed structure of PCO371-bound PTH1R (purple), GCG-bound GCGR (orange), and GIP-bound GIPR (gray). (c) Structural comparison of N5.50 of PCO371-insensitive receptors and PCO371-sensitive receptors, related to Fig. 4d. Violet, PCO371-bound PTH1R; gray, PCO371-insensitive receptors; orange, PCO371-sensitive receptors. (d) Trajectory analysis of three independent simulations with PCO371-bound PTH1R. The top two panels show that PCO371-bound PTH1R maintains an active conformation, resembling our cryo-EM structure. The panel second from the bottom shows the dihedral angle of N3745.50. The angles of PCO371-bound PTH1R (blue) and GLP-1R (red) are shown as dash lines. The bottom panel shows the distance between N3745.50-ND2 and PCO371-O1, representing stably PCO371 interaction with N3745.50 in an intermediate state. (e) Distinct conformation of N3745.50 between PCO371-bound PTH1R and GLP-1-bound active GLP-1R (PDB ID: 6X18). The dihedral angle is calculated with the N–Cα and Cβ–Cγ angles of N5.50. (f) Superimposition of our cryo-EM structure (violet) and a representative snapshot of 1.5 µs MD simulation in run 2 of PCO371-bound PTH1R (yellow). In the simulation, the receptor adopted an intermediate structure, and PCO371 moved toward TM5. (g) Comparison of our cryo-EM structure (violet) and an intermediate structure (yellow) observed in the simulation. PCO371 does not interact with N3745.50 in our cryo-EM structure, while it creates a stable interaction with N3745.50 in the simulation. (h) cAMP accumulation of WT and N3745.50A mutant with PTH and PCO371. The N3745.50A mutant selectively reduced PCO371 response. Symbols and error bars represent mean and SEM, respectively, and dots show individual data of three independent experiments, with each performed in duplicate. * and ** represent P < 0.05 and 0.01, respectively, with two-way ANOVA followed by Dunnett’s test for multiple comparison analysis. ns, not significantly different between the groups.

