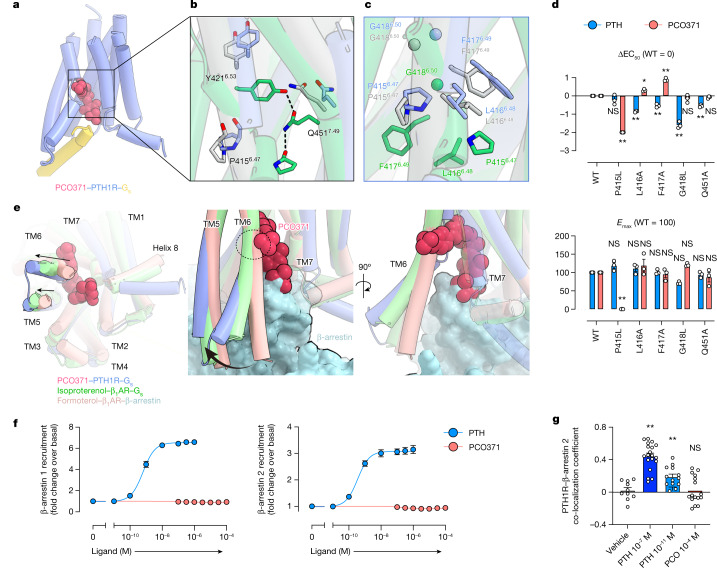
Fig. 3. Distinct activation mechanism of PTH1R induced by PCO371 and PTH.
a, TMD region of PCO371-bound PTH1R. b,c, Magnified view of the PYQ active motif and PxxG active switch. d, GloSensor cAMP responses in wild-type (WT) PTH1R and the PYQ motif or the PxxG switch mutants following PTH or PCO371 stimulation. The negative logarithmic half-maximal effective concentration (pEC50) and the maximum response (Emax) values were calculated from the concentration–response curves (Extended Data Fig. 7a,c). *P < 0.05 and **P < 0.01, calculated using two-way analysis of variance (ANOVA) followed by Dunnett’s test for multiple comparison analysis (with reference to the WT). NS, not significantly different between the groups. e, Superimposition of PCO371–PTH1R–Gs, isoproterenol–β1 adrenaline receptor (β1AR)–Gs and formoterol–β1AR–β-arrestin complexes, aligned on TM2–TM5. Black arrows indicate the hallmark conformational changes of TM5 and TM6 in Gs-bound and β-arrestin-bound structures (left). PCO371 clashes with TM6 in the dashed circle (centre and right). f, Concentration–response curves of β-arrestin 1 and β-arrestin 2 recruitment to PTH1R following stimulation with PTH or PCO371. g, Co-localization of PTH1R–β-arrestin 2 in response to PCO371 and different concentrations of PTH. Quantification of co-localization of PTH1R and β-arrestin 2 after stimulation with vehicle, 100 nM PTH, 10 pM PTH or 100 µM PCO371. The co-localization index for individual cells in each stimulation condition was calculated using Fiji (ImageJ). Symbols and error bars represent the means and s.e.m., respectively, of 10–19 cells. *P < 0.05 and **P < 0.01, calculated using one-way ANOVA followed by Dunnett’s test for multiple comparison analysis with reference to the vehicle stimulation. Data are from three independent experiments (d,f).

