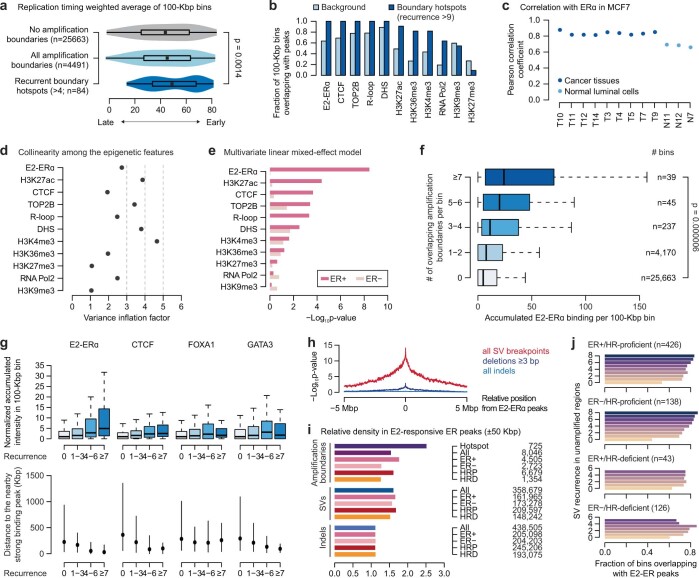
Extended Data Fig. 6. Associations between the epigenomic features and the amplification boundaries.
a. Replication timing and amplification boundaries. Violin plots show the replication timing weighted average values in 100-Kbp bins. The box plot in the center of the violin indicates median (black dot), first and third quartiles (edges), and 1.5× of interquartile range (horizontal line). Comparisons were made by one-sided Wilcoxon’s rank sum test. b. Fraction of 100-Kbp bins overlapping with various epigenomic features in the background and in the recurrent hotspots of amplification boundaries (recurrence >9). The background represents the bins that do not contain amplification boundaries. All epigenomic features were from MCF7 cells, except for TOP2B (from MCF10A cells). DHS, DNase I hypersensitivity sites. c. Pearson’s correlation coefficients between the ERα binding in MCF7 cells and in tissues, including multiple breast cancer samples and normal luminal breast epithelial cells from a previous study (Supplementary Table 3). The analysis is based on 1 Mbp-sized genome-wide bins. d. Assessment of multicollinearity between the epigenomic features by variant inflation factor (VIF; Methods). Some variables showed moderate degree of multicollinearity (VIF 3−5) although others including E2-ERα showed low degree of multicollinearity (VIF < 3). Given these reassuring features, we performed multivariate linear mixed-effect model (panel e), as an adjunct analysis. e. Predictors of amplification boundaries in the multivariate linear mixed-effect model, by the ER status. 100 Kbp-sized genome-wide bins were used in this analysis. Raw p-values from two-sided test are shown. f. A greater cumulative E2-ERα binding is observed in the 100-Kbp bins with more frequent overlaps with the focal amplification boundaries. E2-ERα ChIP-seq data from MCF7 cell line was used in this analysis. Box plots indicate median (thick line), first and third quartiles (edges), and 1.5× of interquartile range (whiskers). Statistical significance was determined by the one-sided rank sum test. g. Binding intensity (fold enrichment) of E2-treated ERα, CTCF, FOXA1, and GATA3 in MCF7 cells based on the 1 Mbp-sized genomic bins with different levels of overlap with the focal amplification boundaries (upper panel). The numbers of genomic bins used in each category are as follows: n = 25663 (recurrence = 0), 4334 (1−3), 118 (4−6), and 39 (≥7). Box plots indicate median (thick line), first and third quartiles (edges), and 1.5x of interquartile range (whiskers). A statistically significant increase in the binding intensity of E2-treated ERα was observed with increasing recurrence of amplification boundaries (p = 2.8 × 10⁻⁶, one-sided Wilcoxon’s rank sum test). Genomic distances from the bins containing the amplification boundaries to the strong binding peaks (top 10%) of E2-ERα, CTCF, FOXA1, and GATA3 in MCF7 cells (lower panel). Black dots indicate median, and the vertical lines indicate the range between first and third quartiles. h. Enrichment of different classes of variants with respect to the expected values under the assumption of uniform distribution in 100-Kbp genomic bins within 5-Mbp window for each E2-induced ERα peak locus. Statistical significance was assessed by one-sided Fisher’s exact test. i. Relative density of amplification boundaries, SVs, and indels by their subgroups around the E2-ERα peaks (±50-Kbp window from the center of the peak). Here, the amplification boundary hotspots were defined as 100-Kbp bins supported by >4 tumors. Number of variants used in the analysis was marked on the right. HRP, HR-proficient tumors; HRD, HR-deficient tumors. j. Subgroup analyses of the relationship between the SV hotspots of the unamplified regions and the frequency of E2-ERα binding peaks in the regions (related to Fig. 3c). A positive correlation between the E2-ERα peaks and the unamplified SV hotspots is observed among the HR-proficient tumors. In contrast, the trend is not found in HR-deficient tumors.

