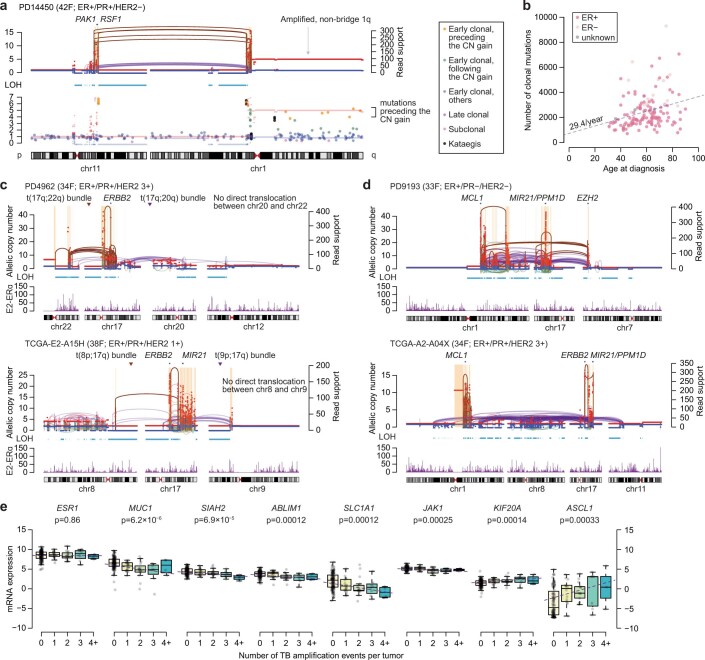
Extended Data Fig. 9. Timing, complexity, and transcriptional impact of translocation-bridge amplification.
a. A TB amplification case from PD14450 showing an amplified non-bridge arm, 1q. The paucity of the SNVs amplified up to the allelic copy-number of 1q indicates that the TB amplification and the subsequent 1q amplification are early events. b. Relationship between the age of diagnosis and the burden of clonal single-nucleotide variations (SNVs) in non-hypermutated, diploid, and HR-proficient breast cancers (Methods). The dashed line is based on linear regression (r = 0.29 by Pearson’s correlation; two-sided p = 0.0004), indicating our cohort’s approximate baseline clonal mutation rate of 29.4/years. A similar analysis using all SNVs in the same group of patients showed a mutation rate of 33.1/years (r = 0.26 by Pearson’s correlation; two-sided p = 0.002; corresponding to a median of 45.3 years for the latest possible timing of bridge breakage). c. Cases suggesting multiple rounds of dicentric chromosome bridge formation and breakage. Translocation bundles are spatially separated on chromosomes. In PD4962 tumor (upper panel), two bundles of translocations were observed — t(17q;20q) and t(17q;22q). However, there is no direct translocation between chromosome 22q and 20q, indicating the two translocation bundles were formed at different time points. In the same way, TCGA-E2-A15H tumor (lower panel) shows t(8p;17q) and t(9p;17q), but no direct connection was observed between 8p and 9p. d. Cases indicating one round of multi-chromosomal TB amplifications, likely involving multiple dicentric chromosomes or a more complex structure, broken and ligated at one event. In contrast to (c), these cases show dense bundles of translocations between all pairs of chromosomes involved in the event. Individual chromosome arms have translocations connected to all other involved chromosome arms, indicating that these arms were in the bridge simultaneously, and the broken DNA fragments were ligated in a mixed manner. In PD9193 tumor (upper panel), chromosomes 1q, 17q, and 7q were rearranged first and underwent massive rearrangements. The LOH selectively affecting one of the two arms of each chromosome is consistent with typical TB amplification. After the catastrophic breaks, the DNA fragments were ligated to form an amplicon containing multiple oncogenes. In TCGA-A2-A04X tumor (lower panel), the initial event might be a chromoplexy involving chromosomes 1, 7, 8, 11, 17. Four telomeric LOH segments were observed in the involved chromosomes, so two dicentric chromosomes would likely have existed and were fragmented simultaneously. e. Associations between the extent of TB amplifications and the expression of estrogen-responsive genes. Numbers of the ER+ tumors used in the right panel are as follows: n = 141 (0 chromosome arm pairs indicating a TB amplification event), 20 (1), 15 (2), 8 (3), and 4 (4). Box plots indicate median (thick line), first and third quartiles (edges), and 1.5× of interquartile range (whiskers). Statistical tests by linear regression, and the gray dashed line is the regression line. Nine out of 273 genes showed statistically significant trend (FDR <0.1 after correcting multiple testing). Among these genes, CDC6 and TOP2A showed significant upregulation among the tumors with extensive TB amplification likely due to their presence in the amplicon. We excluded these two genes from this plot.

