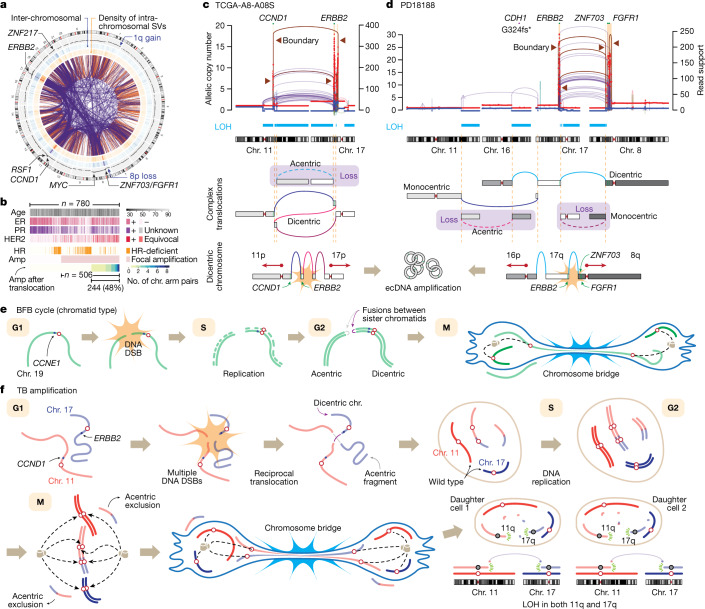
Fig. 2. Translocations lead to the amplification of breast cancer oncogenes via chromosome bridge formation.
a, SVs connecting the amplicon boundaries in 479 breast cancer cases with focal amplifications are overlaid in the centre (orange and purple arcs indicate intra- and inter-chromosomal SVs, respectively). The outermost track shows average copy numbers. b, Clinicopathologic and genomic features of 780 breast cancer cases and their associations with TB amplifications (Amp). Further details in Extended Data Fig. 2d. c, A representative case harbouring focal amplifications in CCND1 and ERBB2. The boundary SVs border the amplified and unamplified segments. We reconstructed the initial rearrangement event on the basis of the boundary SVs or the SVs at the border of the segments showing LOH. Further details in Extended Data Fig. 3. d, Another case with focal co-amplifications after complex translocations. e, A schematic illustration of the classical BFB cycle (chromatid type). f, The TB amplification model. LOH is frequently observed in both arms involved in the TB amplification (c,d). This dual-LOH pattern indicates that the initial translocation happened in the G1 phase (further details in Extended Data Fig. 5c). During mitosis, the replicated, two ‘flipped’ sister dicentric chromosomes form the chromosome bridge.

