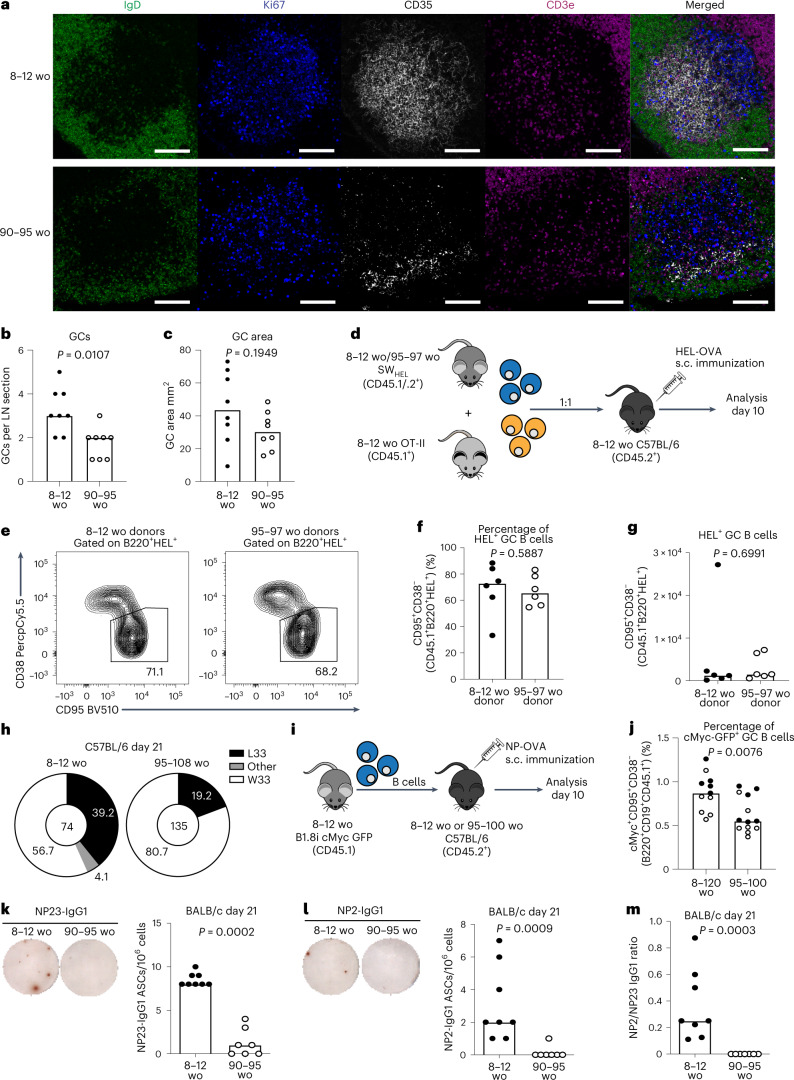
Fig. 1. The GC response, and its output, is diminished in aged mice.
a, Representative confocal images of GCs at ×40 from adult and aged BALB/c mice 14 d after immunization with NP-KLH in alum; scale bars, 50 µm. LN sections were stained for IgD (green), CD35 (white), Ki67 (blue) and CD3e (magenta). b, Enumeration of GCs per LN. c, Quantification of the total GC area (n = 16). d, Experimental outline of the cotransfer of SWHEL B cells from either adult or aged donors alongside OT-II T cells from adult donors into adult C57BL/6 recipient mice in which GC formation was analyzed 10 d after immunization with HEL-OVA in alum. e, Representative flow cytometry plots identifying SWHEL-derived GC B cells (CD95+CD38−CD45.1+B220+HEL+) in recipient mice. The values next to the gates indicate the population percentage. f,g, Quantification of the frequency (f) and total number (g) of SWHEL-derived GC B cells (n = 12). h, Pie charts indicating the frequency of the affinity-inducing mutation W33L in the CDR1 region of VH186.2 sequenced from single-cell sorted NP+IgG1+ GC B cells of adult and aged C57BL/6 mice 21 d postimmunization with 1W1K-NP/alum. The values in the chart center indicate the total number of cells sequenced per group (n = 16). i, Experimental outline of the transfer of B1.8i mycGFP/GFP B cells from adult donors into adult or aged C57BL/6 recipient mice in which GC formation was analyzed 10 d after NP-OVA in alum immunization. j, Quantification of the frequency of B1.8i-derived cMyc+ GC B cells in adult or aged mice; data are pooled from two independent experiments, first experiment in black, second experiment in white (n = 23). k,l, Representative ELISpot well images (left) and quantification (right) of bone marrow NP23- (k) and NP2- (l) specific IgG1 ASCs in BALB/c mice 21 d after immunization with NP-KLH in alum. m, Affinity maturation of bone marrow ASCs from BALB/c mice as determined by the ratio of NP2/NP23-specific ASCs (n = 15). For all experiments, 2–4 experimental repeats were performed with biologically independent samples. In bar graphs, each symbol represents a mouse, and the bar height represents the median. The P values were generated by performing an unpaired two-tailed Mann–Whitney U test. ELISpot, enzyme-linked immunosorbent spot; s.c., subcutaneous; wo, weeks old.

