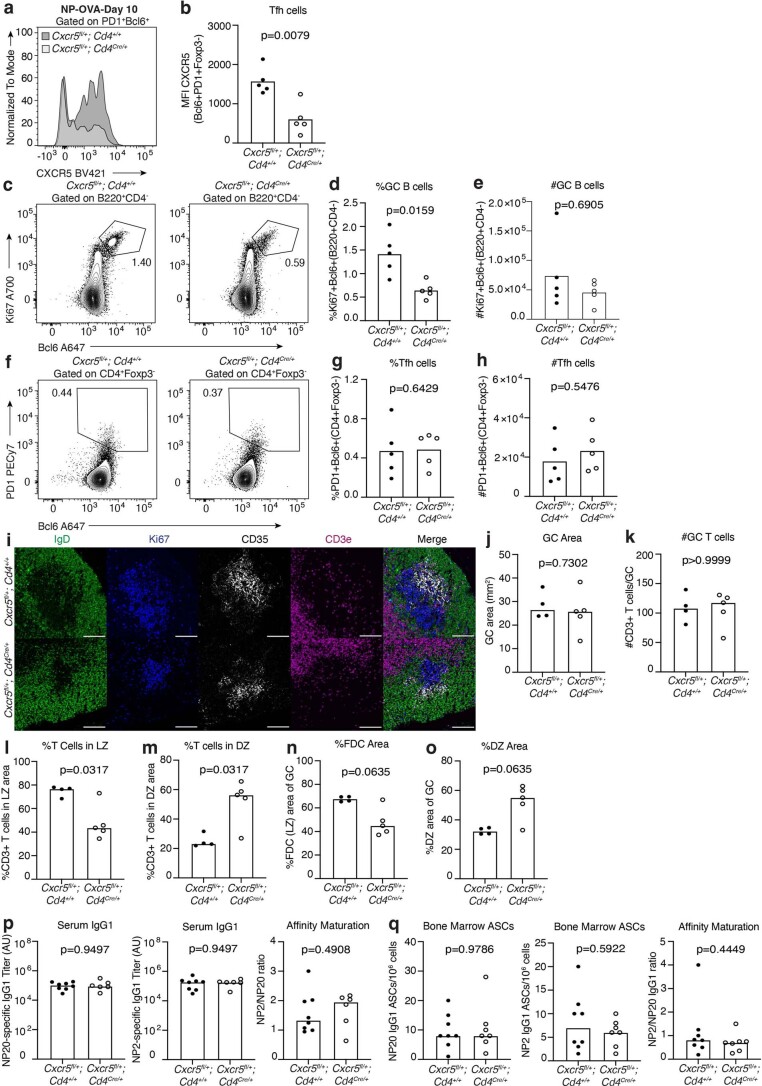
Extended Data Fig. 10. T cell-specific heterozygosity of CXCR5.
Flow cytometry plot of CXCR5 (a) and its median fluorescence intensity (MFI) (b) by PD1+Bcl6+Foxp3− Tfh cells in iLNs of Cxcr5fl/+; Cd4+/+ or Cxcr5fl/+; Cd4Cre/+ mice 10 days after NP-OVA/Alum immunisation. Flow cytometry plots (c) and quantification (d, e) of Ki67+Bcl6+ GC B cells, and flow cytometry plots (f) and quantification (g, h) of PD1+Bcl6+ Tfh cells 10 days after NP-OVA immunisation of Cxcr5fl/+; Cd4+/+ and Cxcr5fl/+; Cd4Cre/+ mice (n = 11). (i) Representative 20x confocal images of GCs at day 10 after NP-OVA immunisation in the iLNs of control Cxcr5fl/+; Cd4+/+ mice (top) and Cxcr5fl/+; Cd4Cre/+ mice (bottom); scale bar is 100 µm. IgD (green), Ki67 (blue), CD35 (white) and CD3e (magenta). Quantification of the total GC area (j), the total number of CD3+ T cells within the GC (k), the percentage of CD3+ T cells localising to the CD35+ light zone area (l) and the Ki67+CD35− dark zone area (m), the CD35+ FDC network light zone area (n) and the Ki67+CD35− dark zone area (o) in iLNs of Cxcr5fl/+; Cd4+/+ and Cxcr5fl/+; Cd4Cre/+ mice (n = 14). (p) Serum titres of NP20 and NP2 specific IgG1, and their ratio of Cxcr5fl/+; Cd4+/+ and Cxcr5fl/+; Cd4Cre/+ mice 35 days post-immunisation with NP-OVA. (q) Enumeration of NP20 (left) and NP2 (middle) IgG1 antibody-secreting cells (ASCs) and affinity maturation indicated by the ratio of NP2/NP20 ASCs (right) in the bone marrow of Cxcr5fl/+; Cd4+/+ and Cxcr5fl/+; Cd4Cre/+ mice at 35 days post-immunisation with NP-OVA. Data on (p) and (q) are pooled from two independent experiments and symbol colour represents different experiments (n = 19). For all bar graphs, bar height indicates the median, each symbol represents a mouse, and p-values were obtained by performing an unpaired, two-tailed Mann-Whitney U test. Data are representative of two independent experiments.

