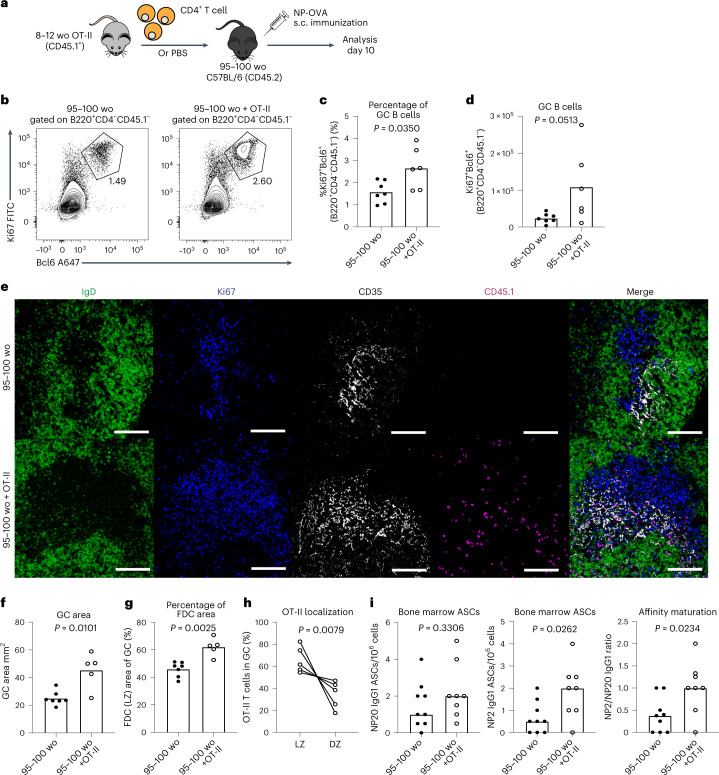
Fig. 7. T cell transfer can boost the aged GC response, FDC expansion and humoral immunity.
a, Experimental outline of the adoptive transfer of CD4+ T cells, isolated from adult OT-II mice, into aged C57BL6 recipients which were then subcutaneously immunized with NP-OVA/alum and analyzed 10 d after immunization. Control aged C57BL/6 recipient mice were injected with PBS instead of OT-II cells. b–d, Representative flow cytometry plots (b) and the percentage (c) and total number (d) of Ki67+Bcl6+ GC B cells in aged C57BL/6 mice that received either an injection of PBS (left) or CD4+ OT-II T cells (right); values adjacent to gates indicate percentage (n = 13). e, Representative confocal images of GCs at day 10 after NP-OVA immunization in the iLNs of aged C57BL/6 mice that received either an injection of PBS (top) or CD4+ OT-II T cells (bottom). Images were taken at ×20 magnification; scale bar, 100 µm. LN sections were stained for IgD (green), Ki67 (blue), CD35 (white) and CD45.1 (magenta). f–h, Quantification of the total area of GCs (f), the CD35+ FDC network area (g) and the percentage of transferred OT-II cells in the light or dark zones (h) in the iLNs of aged C57BL/6 mice that received an injection of PBS or CD4+ OT-II T cells (n = 12). i, Enumeration of NP20 (left) and NP2 (middle) IgG1 ASCs and affinity maturation indicated by the ratio of NP2/NP20 ASCs (right) in the bone marrow of aged mice that received OT-II cells or PBS at 35 d postimmunization with NP-OVA/alum (n = 17). For all bar graphs, bar height indicates the median, each symbol represents a mouse and P values were obtained by performing an unpaired, two-tailed Mann–Whitney U test. In h, P value is from a paired t-test, and individual mice are connected with a line. Data are representative of two independent experiments.

