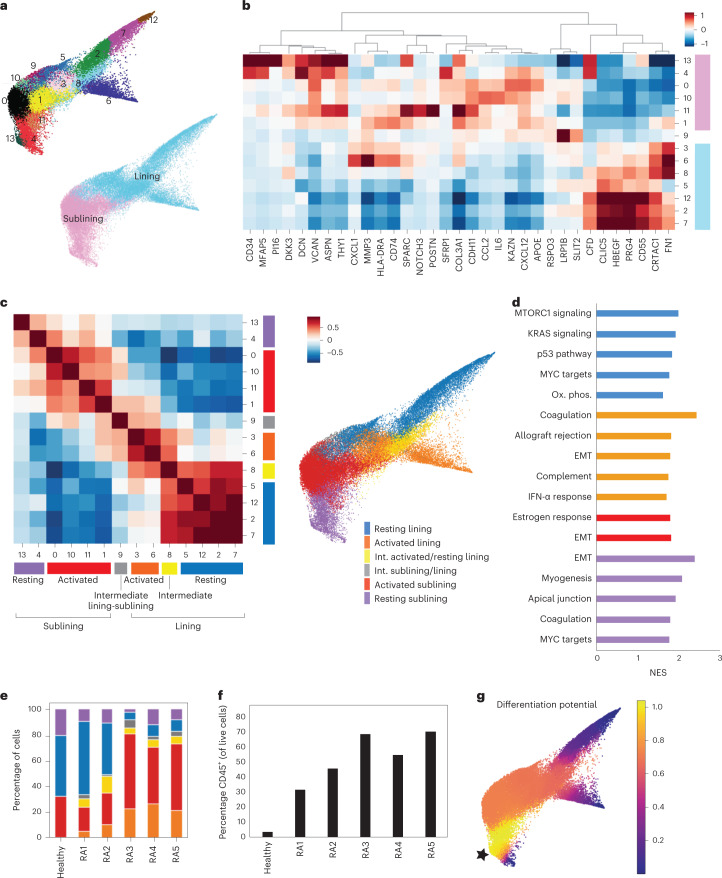
Fig. 1. FLS states in the RA synovium exhibit evidence of activation by immune cells.
a, Force-directed layout of 14 FLS clusters identified by scRNA-seq analysis with Harmony batch correction with corresponding annotations of synovial localization. b, Heat map of selected differentially expressed genes (DEGs) for each cluster colored by synovial localization. c, Cluster-by-cluster correlation of the mean expression of highly variable genes in clusters from a with defined FLS states colored on the force-directed layout. d, GSEA showing top HALLMARK pathways with false discovery rate (FDR) < 0.1 (up to 5) for each of the states defined in c. EMT, epithelial–mesenchymal transition; NES, normalized enrichment score. e, Percent FLS in each state defined in c for each synovial tissue sample. f, Percent CD45+ cells in each of the dissociated synovial tissue samples by flow cytometry. g, Trajectory analysis using Palantir starting from a sublining cell from the healthy synovial sample (starting point marked with a star).

