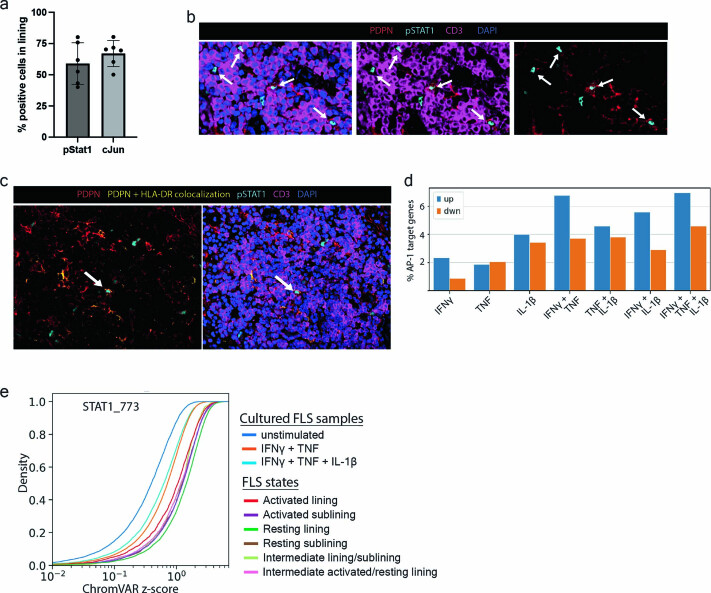
Extended Data Fig. 5. Evidence of STAT1 and AP-1 activation in FLS.
a, Percentage of cells staining for nuclear pSTAT1 or cJun found within the synovial lining, which was manually annotated based on tissue architecture, in confocal images from Fig. 4d (n = 3 tissues, 6 sections). Error bars: mean ± standard deviation. b, Representative confocal images of a lymphocyte aggregate within the sublining stained for phosphorylated STAT1 (cyan), PDPN (red), CD3 (magenta) and nuclear marker (blue) (n = 4 tissues, 8 sections). White arrows indicate FLS with nuclear pSTAT1. c, Representative confocal images of a lymphocyte aggregate stained for the antigens in (b) above as well as the colocalization of HLA-DR and PDPN (yellow) as defined by pixels with fluorescence intensity in the top 10% for both HLA-DR and PDPN (n = 3 tissues). d, Percent of genes identified in the multiome dataset with accessible AP-1 motifs in their promoters that were up- or down-regulated in cultured FLS stimulated with the indicated cytokines. AP-1 target genes (1024 total) in the activated lining FLS state were identified as those with motif matches with a log-odds score of at least 10 (computed by motifmatchr). e, Dynamics of chromatin accessibility of the STAT1 motif containing cis-regulatory elements across ex vivo FLS states and in vitro cytokine stimulated or unstimulated FLS. Empirical cumulative distribution function (ECDF) 600 plots of ChromVAR z-scores for STAT1 motif from scATAC-seq analysis of the indicated cultured FLS samples or FLS states are shown.

