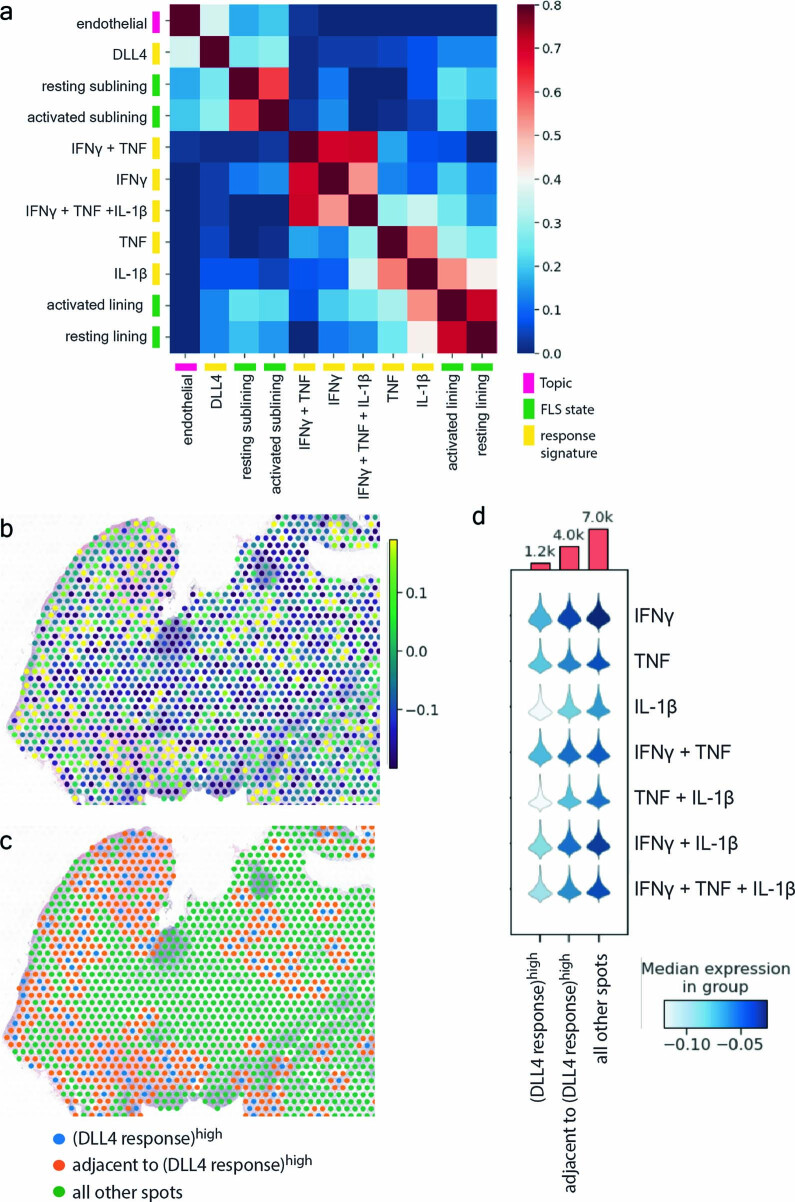
Extended Data Fig. 7. Spatial distribution of Notch signaling in FLS.
a, Correlation between localization of endothelial cells (defined by topic modeling), FLS state gene signatures derived from scRNA-seq data and in vitro cytokine or DLL4 response gene signatures within individual RNA capture spots (n = 2 sections for patient RA3 in Supplementary Table 1). b, Relative expression of the FLS response gene signature to stimulation by plate bound DLL4 in each RNA capture area on the ST slide (n = 2 tissues, 2 sections each: RA3 shown). c, Annotation of each RNA capture area into three groups: DLL4 response gene signature score in the top 10th percentile (blue), directly adjacent to these areas (orange), or all other spots (green) (n = 2 tissues, 2 sections each: RA3 shown). d, Violin plot showing the expression of the FLS-specific cytokine response gene signatures in the areas defined in panel (c) (aggregated data from all 4 sections from 2 tissues: RA3 and RA6). The top shows the number of total RNA capture areas in the groups defined in panel (c) for all tissue sections.

