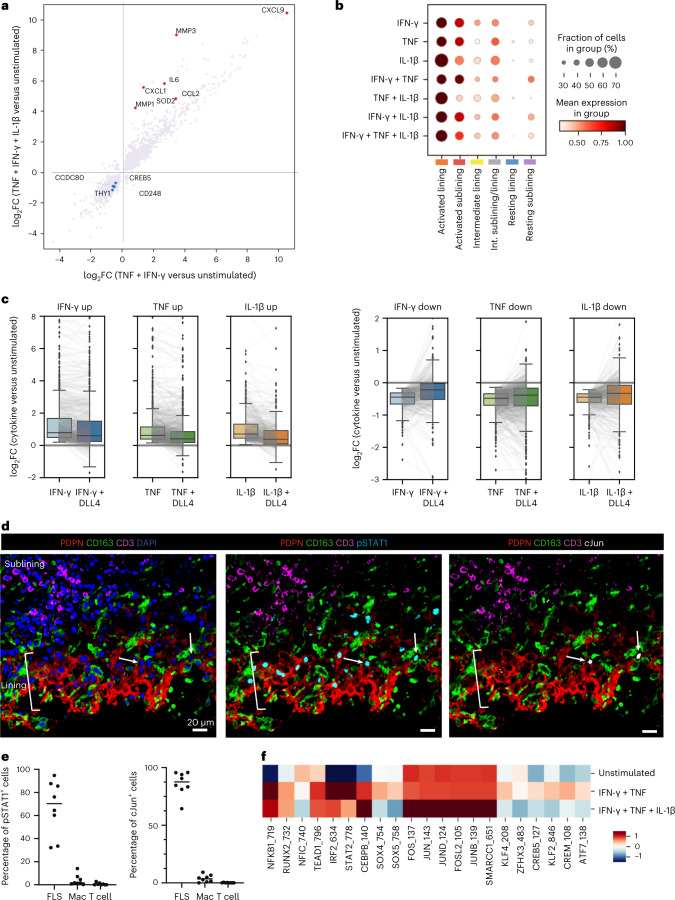
Fig. 4. Cytokine signaling drives transcriptional FLS heterogeneity.
a, Changes in gene expression (log fold change) after combinatorial stimulation of cultured FLS by the cytokines indicated. Red and blue dots highlight upregulated and downregulated genes, respectively. b, Dot-plot showing relative expression of the identified cytokine response signatures in each of the FLS states. c, Effect of Notch signaling on FLS cytokine responses. Cultured FLS were treated with the individual cytokines indicated in vitro and RNA-seq was used to identify genes that were upregulated (left) or downregulated (right). Box plots compare the distribution of log2 fold changes in the expression of these genes (in stimulated versus control) in FLS treated with each cytokine alone or in combination with DLL4. Gray lines connect individual genes across conditions. Boxes show lower and upper quartiles of the data with a line marking the median. Whiskers indicate extent of data, capped at 1.5 times the interquartile range, outside of which points are marked as outliers (ticks). d, Representative confocal images of staining for pSTAT1 (cyan), cJun (white), PDPN (red), CD163 (green), CD3 (magenta) and nuclear marker (blue) (n = 4 tissues with total of eight sections). White arrows indicate FLS with nuclear cJun staining in the lining. e, Percentage of cells staining for nuclear pSTAT1 or cJun annotated as FLS, macrophage (Mac) or T cell as identified by cell markers PDPN (FLS), CD163 (macrophage) and CD3 (T cell) in confocal images from d. f, ChromVAR z score of motifs from Fig. 3d in cultured FLS that were unstimulated, simulated with TNF and IFN-γ or stimulated with TNF, IFN-γ and IL-1β.

