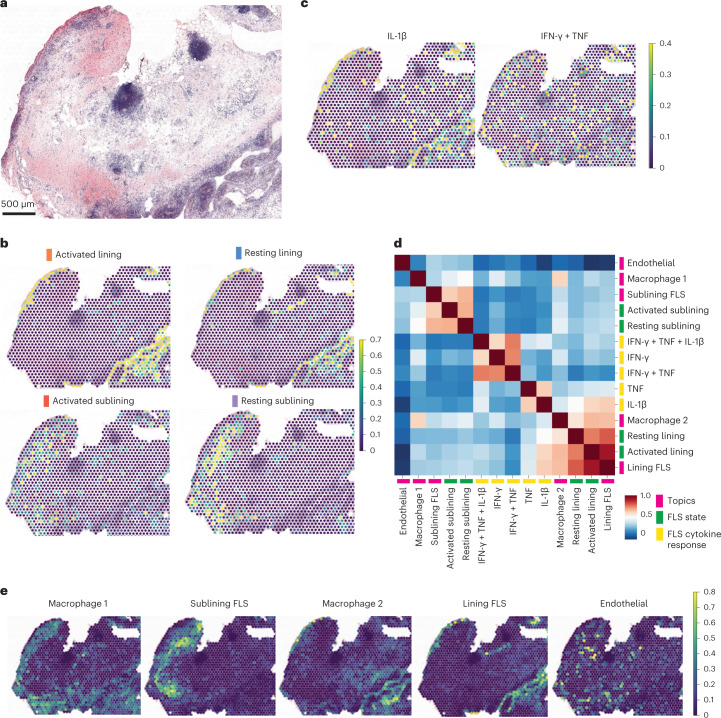
Fig. 5. Cytokine signaling is spatially constrained and correlated with cellular localization.
a, H&E staining of a tissue section used for ST (RA3 in Supplementary Table 1) (n = 2 tissues for ST; other tissue shown in Extended Data Fig. 6). b, Relative expression of FLS states in each RNA capture area on the ST slide. c, Relative expression of selected FLS cytokine response signatures in each RNA capture area on the ST slide. d, Correlation between FLS state gene signatures derived from scRNA-seq data, in vitro cytokine response gene signatures and cell types as defined by topic modeling within individual RNA capture spots for RA3. e, Expression of cell type-specific topics from d in each RNA capture area on the ST slide.

