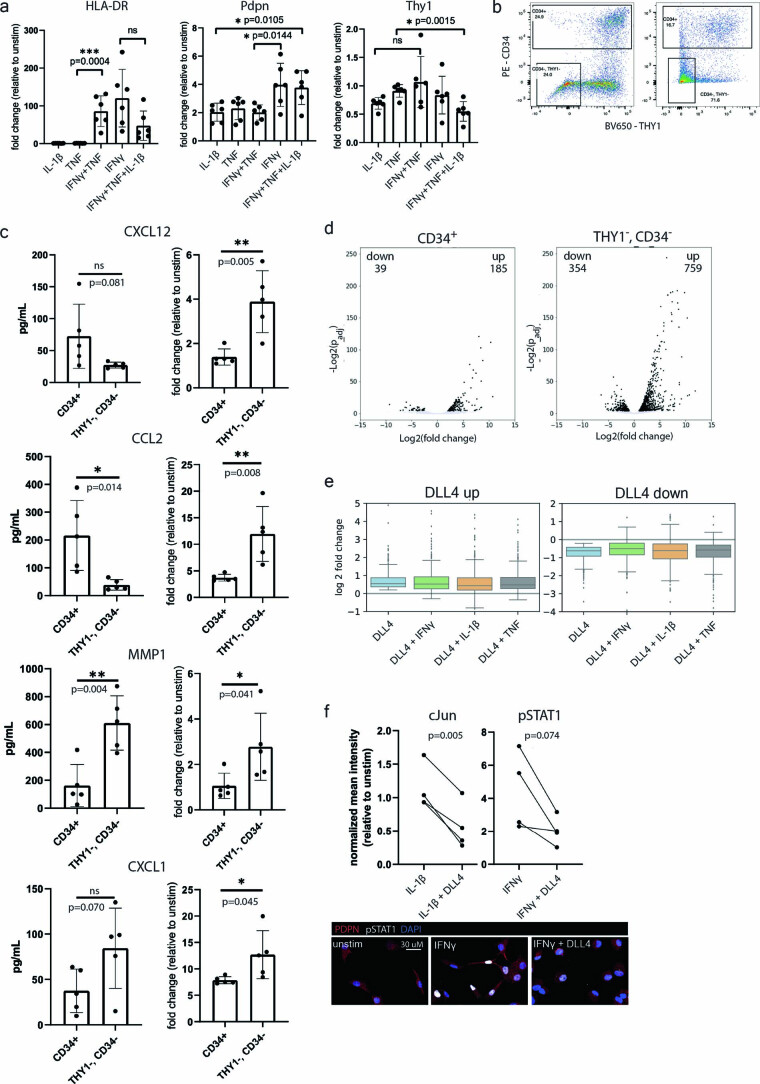
Extended Data Fig. 4. Effects of cytokine and Notch signaling on FLS.
a, Surface protein expression of HLA-DR, PDPN and Thy1 on cultured FLS as measured by flow cytometry (mean fluorescence intensity) after indicated stimuli relative to unstimulated FLS (n = 6: FLS isolated from 6 different tissues and assayed independently). Error bars: mean ± standard deviation. Statistical comparisons made via unpaired t-test with two-tailed p-value. b, Two representative flow cytometry plots from tissues with different population distributions showing gating strategy for FACS sorting of CD34+ and THY1-CD34- FLS used following the gating strategy shown in Extended Data Fig. 1a. c, Expression of soluble proteins by CD34+ sublining or THY1-CD34- lining FLS directly sorted from dissociated synovium and cultured for 24 h either without stimulation (left) or with TNF, IFNγ and IL-1β (right) (n = 5 tissues). Error bars: mean ± standard deviation. Statistical comparisons made via unpaired t-test with two-tailed p-value. d, Changes in gene expression by bulk RNA-seq in sorted CD34+ sublining or THY1-CD34- lining FLS stimulated with TNF, IFNγ and IL-1β relative to unstimulated controls (n = 2 of tissues used in panel c). Differentially expressed genes were determined using DEseq2 with cutoff at p < 0.05 and absolute log2FC > 1. e, Effect of the cytokine simulation in combination with DLL4 on genes induced or downregulated by FLS treatment with DLL4 alone. Box plots compare the distribution of log2 fold changes in the expression of these genes (in stimulated versus control) in FLS treated with DLL4 alone or in combination with cytokine. Boxes show lower and upper quartiles of the data with line marking the median. Whiskers indicate extent of data, capped at 1.5 times the interquartile range, outside of which points are marked as outliers (ticks). f, Effect of Notch signaling on transcription factor activation in cultured FLS as measured by IF. Mean normalized intensity of nuclear cJun or pSTAT1 after simulation with IL-1β or IFNγ, respectively, with or without DLL4 relative to unstimulated (n = FLS from 4 tissues). Statistical comparisons made via paired t-test with two- tailed p-value. Below: representative confocal images of cultured FLS stimulated with IFNγ with or without DLL4 and stained for pSTAT1 (cyan), PDPN (red) and nuclear marker (blue).

