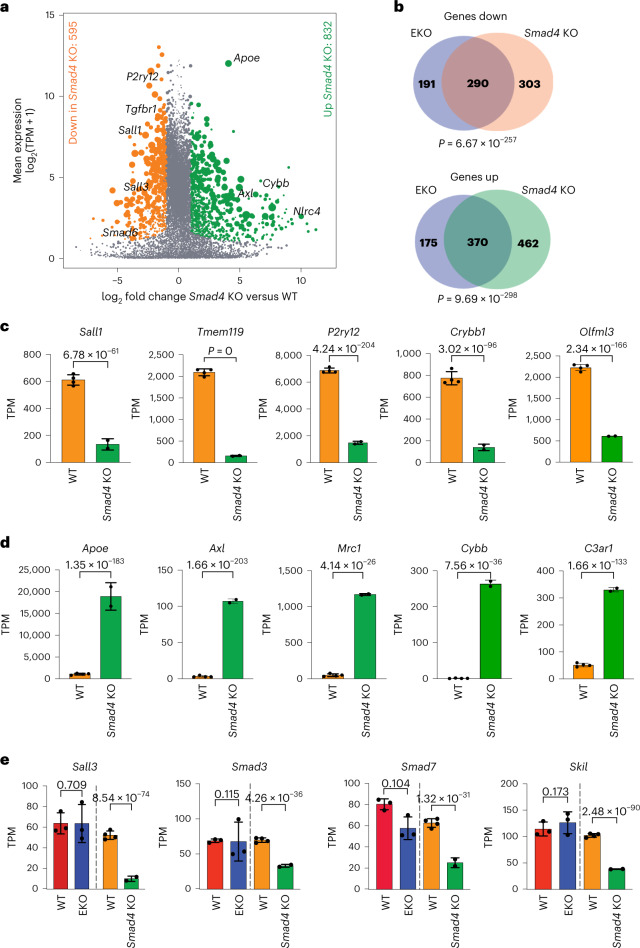
Fig. 5. Loss of Smad4 phenocopies loss of Sall1.
a, MA plot of RNA-seq data comparing WT and Smad4 cKO microglia. n = 2–4 per group. DEGs were defined as p-adj <0.05, FC >2 or <−2, and log2(TPM + 1) >4 in at least one group. p-adj calculated from DESeq2 analysis (Wald’s test with multiple testing correction using Benjamini–Hochberg method). See also Extended Data Fig. 9. b, Overlap of DEGs in EKO microglia versus Smad4 cKO microglia. P value was calculated using one-tailed Fisher exact test. c, Bar plots for expression of downregulated genes in Smad4 cKO (green) as compared with WT (orange) microglia. n = 2–4 per genotype. Data are represented as mean with standard deviation, p-adj from DESeq2 analysis (Wald’s test with multiple testing correction using Benjamini–Hochberg method). d, Bar plots for expression of upregulated genes in Smad4 cKO (green) microglia as compared with WT (orange). n = 2–4 per genotype. Data are represented as mean with standard deviation, p-adj from DESeq2 analysis (Wald’s test with multiple testing correction using Benjamini–Hochberg method). e, Bar plots comparing expression of genes differentially expressed in WT versus EKO and WT versus Smad4 cKO, n = 2–4 per genotype. Data are represented as mean with standard deviation, p-adj from DESeq2 analysis (Wald’s test with multiple testing correction using Benjamini–Hochberg method).

