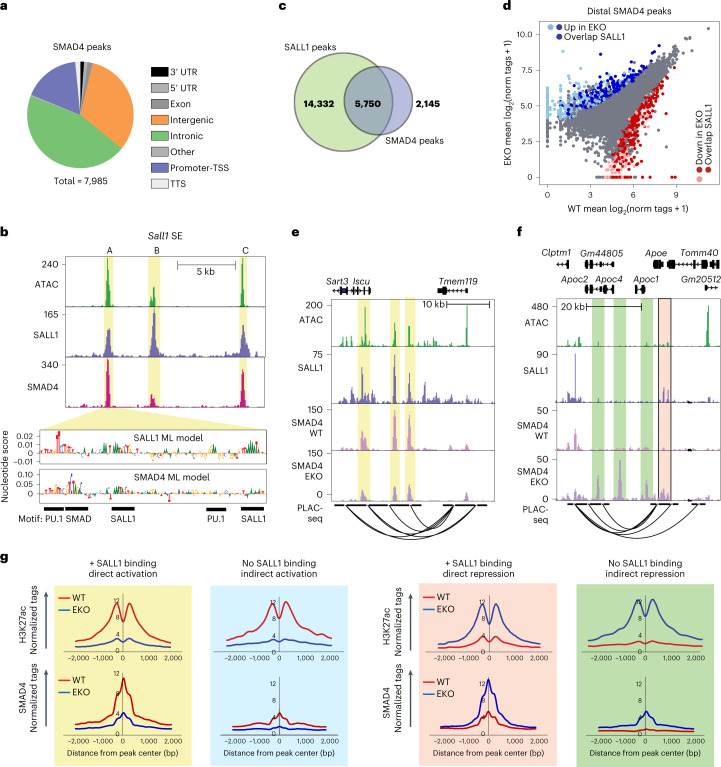
Fig. 6. SALL1 enforces a microglia-specific pattern of DNA binding and function of SMAD4.
a, Pie chart representing distribution of IDR-defined SMAD4 peaks (n = 2). UTR, untranslated region. b, Genome browser tracks of H3K27ac ChIP–seq, ATAC, and SALL1-, PU.1- and SMAD4-ChIP–seq at the Sall1 SE in WT microglia. Yellow highlights and A, B and C labels represent the three main regions of open chromatin in the SE. c, Overlap of IDR-defined SALL1 and SMAD4 peaks in WT microglia. d, Scatter plot of distal SMAD4 peaks overlapping with SALL1 binding sites. Color codes indicate significant changes (light red and light blue are p-adj <0.05, FC >2 or <−2, p-adj from DESeq2 analysis (Wald’s test with multiple testing correction using Benjamini–Hochberg method)) and significant changes overlapping with SALL1 binding sites (dark red and dark blue). e, Genome browser tracks of ATAC, SALL1 and PLAC-seq in WT microglia and SMAD4 in EKO and WT microglia at the Selplg/Tmem119 locus. Yellow highlights indicate regions where SMAD4 binding is diminished in EKO upon loss of SALL1 binding. f, Genome browser tracks of ATAC, SALL1 and PLAC-seq in WT microglia and SMAD4 in EKO and WT microglia at the Apoe locus. Pink highlight shows region where loss of direct SALL1 binding leads to increased SMAD4 signal in EKO. Green highlights demonstrate regions where SMAD4 binding increases in EKO, independent of a SALL1 binding site. g, Histograms of normalized H3K27ac and SMAD4 counts from EKO and WT microglia at peak subsets defined in c. Red, WT; blue, EKO.

