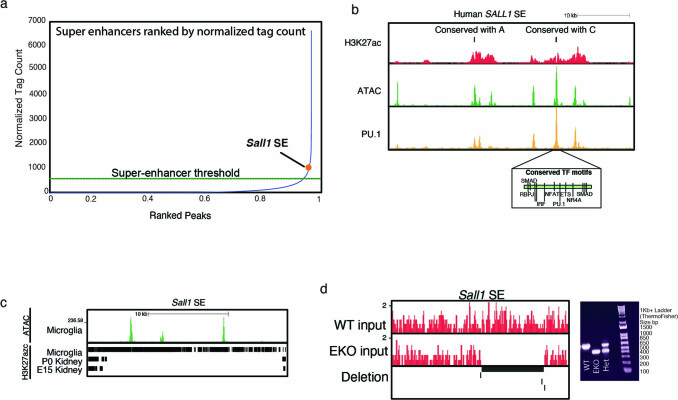
Extended Data Fig. 1. Deletion of the Sall1 super-enhancer.
a. Plot of WT microglia enhancers ranked by normalized H3K27ac tag count. Dotted line represents the cutoff for an enhancer to be considered a super-enhancer. b. Genome browser of the human SALL1 super-enhancer with H3K27ac ChIP, ATAC, and PU.1 ChIP. Regions conserved with the mouse Sall1 super-enhancer Region A and Region C are marked above the H3K27ac. Conserved TF binding sites are annotated in the region homologous to mouse Region C. c. Genome browser of the mouse Sall1 super-enhancer and the overlap of mouse H3K27ac in microglia and embryonic/early postnatal kidney. d. Genome browser showing input DNA from microglia and the Sall1 SE deletion (n = 4–6 mice/geno- type over > 3 experiments). Primers used for genotyping are marked below, and results from geno- typing are shown on the right. Genotyping was performed for all mice utilized in this study (>40 mice over >12 experiments).

