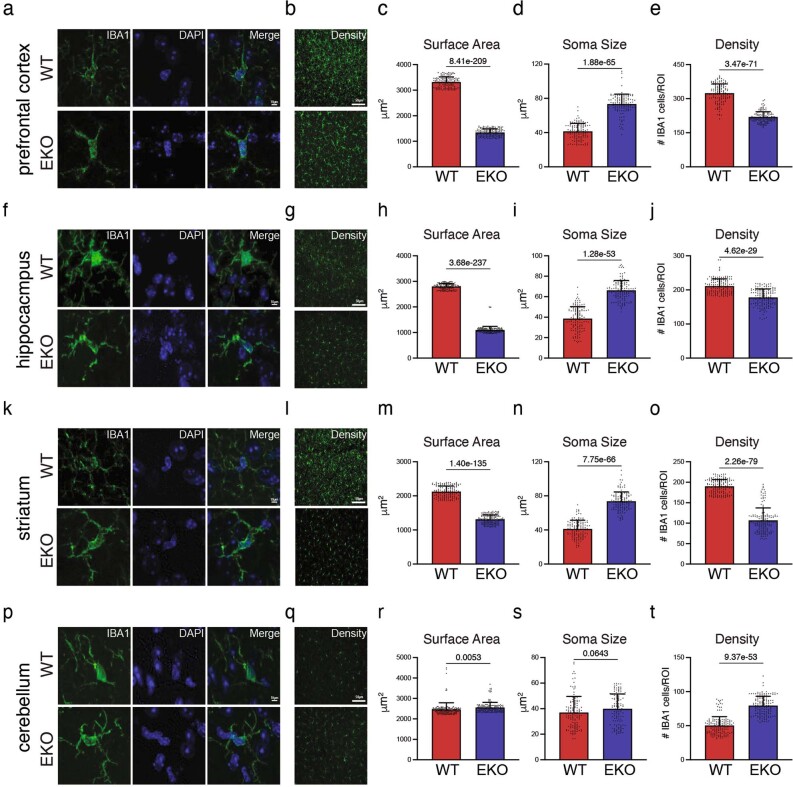
Extended Data Fig. 3. Quantitative analysis of microglia surface area, soma size and density in different brain regions of WT and SALL1 EKO mice.
a,b. Representative brain section of the prefrontal cortex co-stained with IBA1 and DAPI. c,d,e. Prefrontal cortex - Quantification of surface area (n = 150 microglia/brain region/genotype), soma size (n = 124 microglia/brain region/geno- type), density (n = 142 microglia/brain region/genotype). f,g. Representative brain section of hippocampus co-stained with IBA1 and DAPI. h,i,j. Hippocampus - Quantification of surface area (n = 150 microglia/brain region/genotype), soma size (n = 124 microg- lia/brain region/genotype), density (n = 142 microglia/brain region/genotype). k,l. Representative brain section of striatum co-stained with IBA1 and DAPI. m,n,o. Striatum - Quantification of surface area (n = 150 microglia/brain region/genotype), soma size (n = 123 microg- lia/brain region/genotype), density (n = 150 microglia/brain region/genotype). p,q. Representative brain section of cerebellum co-stained with IBA1 and DAPI. r,s,t. Cerebellum - Quantification of surface area (n = 150 microglia/brain region/genotype), soma size (n = 123 microg- lia/brain region/genotype), density (n = 150 microglia/brain region/WT, n = 147 microglia/brain region/EKO). 15 ROIs, 4 sections per brain region, 2-3 mice/genotype. Unpaired two-tailed t-test with Welch’s correction was used to calculate significance. Data are represented as mean with s.d.

