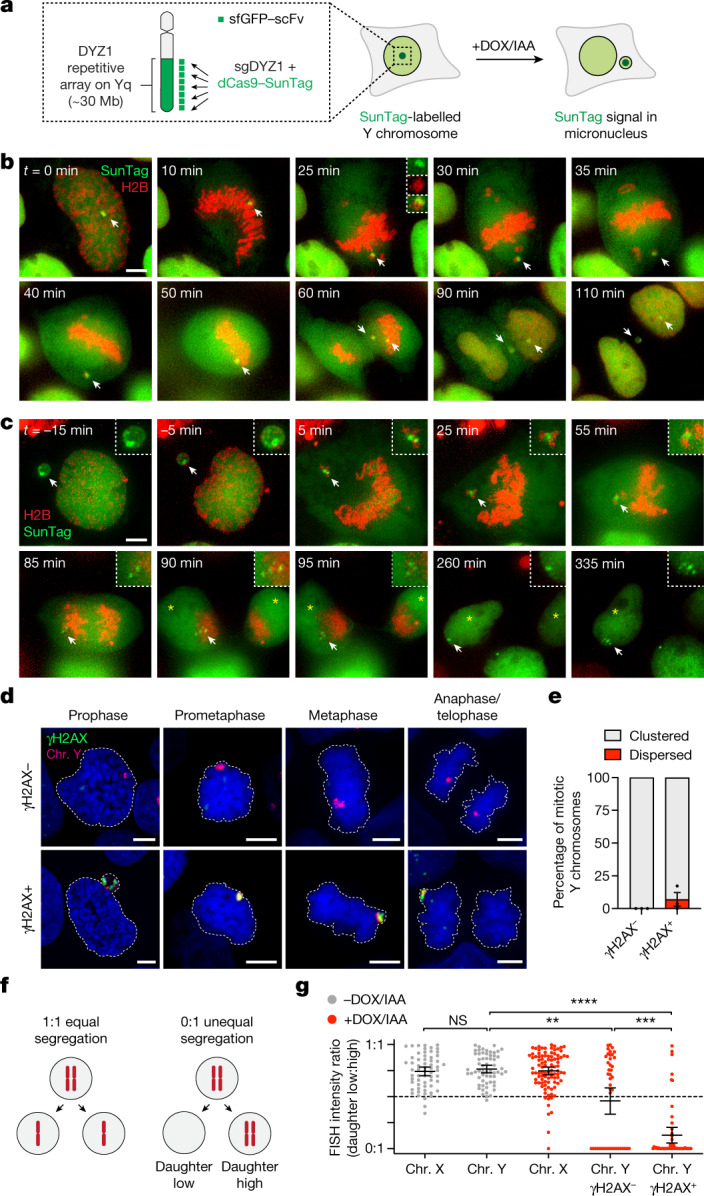
Fig. 1. Pulverized chromosomes from micronuclei spatially cluster throughout mitosis for biased inheritance by a single daughter cell.

a, Schematic of the chromosome-labelling strategy using a dCas9–SunTag to target sfGFP fused to a single-chain variable fragment (sfGFP–scFv) to the Y-chromosome DYZ1 satellite array. Treatment with DOX/IAA triggers Y centromere inactivation and chromosome missegregation into micronuclei. b, Time-lapse images of a dCas9–SunTag-labelled Y chromosome (white arrow) missegregating into a micronucleus during mitosis after induction with DOX/IAA for 2 days. c, Time-lapse images of a dCas9–SunTag-labelled Y chromosome in a micronucleus clustering throughout mitosis with uneven distribution of the SunTag signal between daughter cells (yellow asterisks). A representative example is shown from n = 13 events obtained from independent experiments. In b and c, chromatin is labelled with H2B–mCherry. Scale bar, 5 μm. d, Micronuclear chromosome clustering in fixed DLD-1 cells at different stages of mitosis visualized by DNA FISH with chromosome paint probes. γH2AX was used to identify pulverized chromosomes from micronuclei with extensive DNA damage. DNA was stained with 4′,6-diamidino-2-phenylindole (DAPI) (blue). Scale bar, 5 μm. e, Quantification of fragment clustering with and without γH2AX from prometaphase to metaphase. Data are mean ± s.e.m. of n = 3 independent experiments; n = 595 (γH2AX−) and n = 230 (γH2AX+) cells. f, Schematic of chromosome distribution in a 1:1 or 0:1 segregation ratio between daughter cell pairs. g, FISH measurements between pairs of daughter cells indicate that pulverized chromosomes (chr.) are asymmetrically inherited by a single daughter. Data are mean ± 95% confidence intervals. Statistical analysis was performed using non-parametric Kruskal–Wallis test with correction for multiple comparisons; not significant (NS), P > 0.05; **P = 0.0026, ***P = 0.0006, ****P ≤ 0.0001. From left to right, n = 61, 61, 95, 44 and 51 daughter cell pairs pooled from 3 independent experiments. Representative images are shown in Extended Data Fig. 2f.
