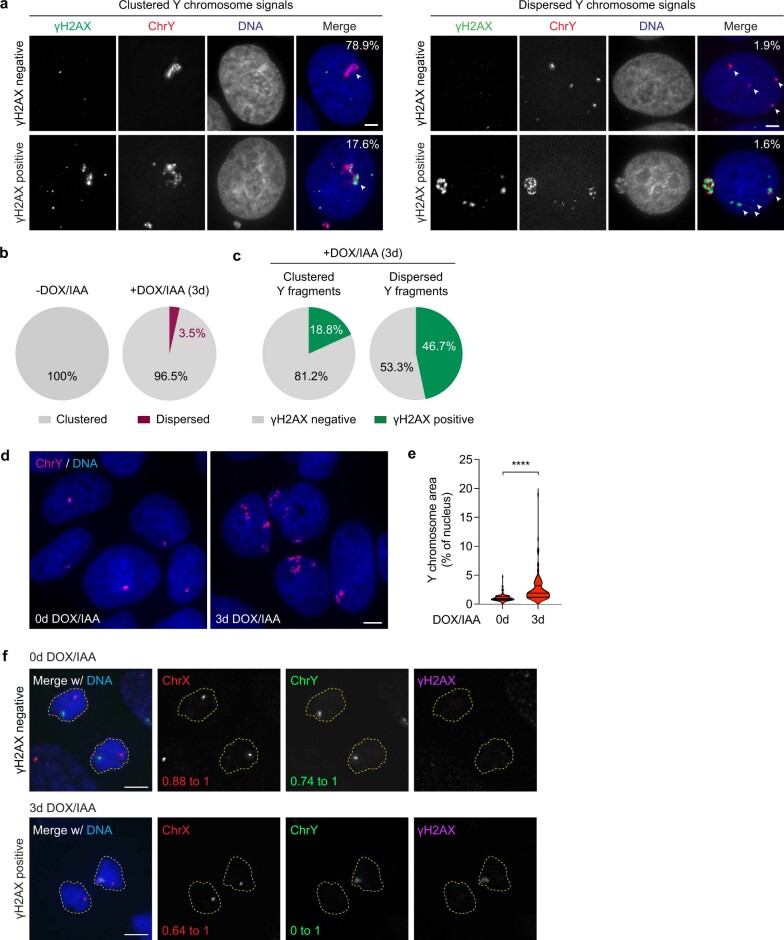
Extended Data Fig. 2. Micronucleation produces clusters of damaged chromosome fragments that unequally reincorporate into daughter cell nuclei.
a) Examples of clustered (left panels) and dispersed (right panels) Y chromosome signals in the interphase nucleus with or without γH2AX. Percentages shown represent the proportion of cells that exhibit each category following 3d DOX/IAA treatment. Scale bar, 5 μm. b) Pie charts depicting the fraction of control or DOX/IAA-treated cells with clustered or dispersed Y chromosome fragments during interphase. Data pooled from 2 independent experiments; -DOX/IAA: n = 376, +DOX/IAA: n = 858 cells. c) Pie charts depicting the γH2AX status of clustered and dispersed Y chromosome fragments. Data pooled from 2 independent experiments; clustered: n = 828, dispersed: n = 30 fragments. d) Re-integrated Y chromosome fragments occupy a larger nuclear space with increased nuclear fluorescence signal area following DOX/IAA treatment. Scale bar, 5 μm. e) Violin plot quantification of (d) measuring Y chromosome FISH area over the total area of the nucleus, as indicated by DAPI staining; data pooled from 0d: n = 103, 3d: n = 105 Y chromosome clusters; ****P ≤ 0.0001 by Welch’s two-tailed unpaired t-test. f) Images of equal segregation of an intact Y chromosome (top) and pulverized Y chromosome exhibiting unequal partitioning between daughter cells. Scale bar, 5 μm. Quantification shown in Fig. 1g.

