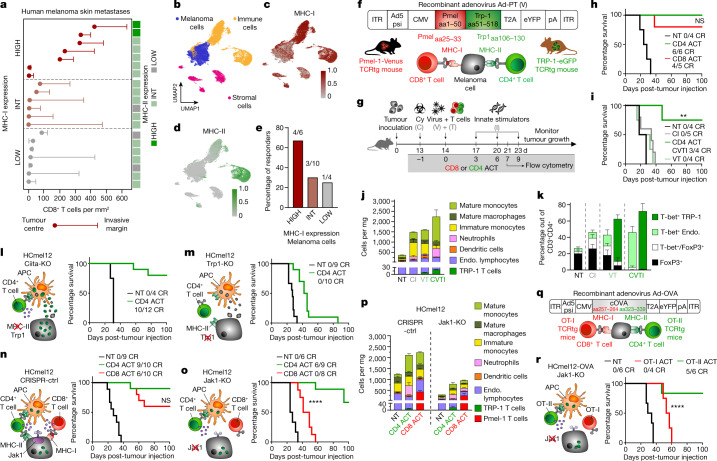
Fig. 1. A small population of CD4+ effector T cells can eradicate MHC-deficient and IFN-unresponsive melanomas that resist destruction by CD8+ cytotoxic T cells.
a, Density of CD8+ T cells infiltrating the tumour centre and the invasive margin of 20 human melanoma skin metastases and corresponding MHC-I and MHC-II expression, categorized into high, intermediate (int) and low expression. b, UMAP of single-cell transcriptomes from an extra set of 20 melanoma metastases in skin (n = 5), subcutis (n = 4) and lymph nodes (n = 11) annotated for melanoma, immune and stromal cell phenotypes. c,d, MHC-I (c) and MHC-II (d) gene set expression in single melanoma cells. e, ICB therapy responders in patients with high, intermediate and low MHC-I expression on melanoma cells. f, Structure of recombinant adenovirus Ad-PT. g, Experimental protocol for ACT immunotherapy of established tumours in mice (Cy, C, cyclophosphamide; V, Ad-PT; T, TCRtg Pmel-1 CD8+ or TRP-1 CD4+ T cells; I, innate stimuli, polyI:C and CpG) and time point for flow cytometric analyses. h,i, Kaplan–Meier survival curves of mice bearing established B16 melanomas and treated either with CD4 ACT or CD8 ACT (h) or with the indicated components of the CD4 ACT protocol (i). NT, non-treated; CR, complete responders. i, **P = 0.0084. j,k, Immune cell composition (n = 2 biologically independent samples) (j) and phenotype of endogenous and transferred (VT, CVTI, right columns) CD4+ T cells (k) in tumours treated as indicated (mean ± s.e.m. from n = 4 biologically independent samples). l–o, Graphical representation of the immune cell interaction phenotypes (left) and Kaplan–Meier survival curves (right) of mice bearing established Ciita-KO (l), Trp1-KO (m), CRISPR-ctrl (n) or Jak1-KO (o) melanomas and treated as indicated. o, ****P < 0.0001. p, Immune cell composition of tumours treated as indicated (mean ± s.e.m. from four biologically independent samples). q, Structure of recombinant adenovirus Ad-OVA. r, Graphical representation of the immune cell interaction phenotype of ovalbumin-expressing HCmel12 Jak1-KO cells (left) and Kaplan–Meier survival curves (right) of mice bearing established melanomas treated as indicated. ****P < 0.0001. Survival was statistically compared using a log-rank Mantel–Cox test. NS, not significant.

