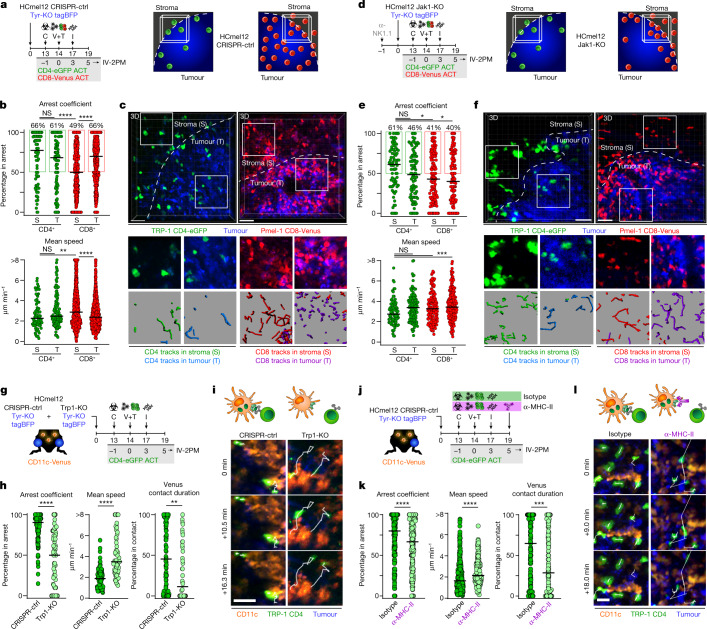
Fig. 2. CD4+ effector T cells interact with MHC-II-expressing CD11c+ antigen-presenting cells in clusters within the invasive tumour margin.
a,d, Experimental protocols to assess the distribution of adoptively transferred T cells (left) and graphics depicting the invasive tumour margin (right) of CRISPR-ctrl (a) or Jak1-KO (d) tumours. b,e, Arrest coefficient and mean speed of adoptively transferred Venus+ Pmel-1 CD8+ (red) and eGFP+ TRP-1 CD4+ T cells (green) in the stromal (S) and tumoural (T) compartment at the invasive margin (bars indicate the median) of CRISPR-ctrl (b) or Jak1-KO (e) tumours (75–842 cells examined from three independent experiments; ****P < 0.0001, ***P = 0.0007, **P = 0.0068, CD4+ versus CD8+ in stroma *P = 0.0204, CD4+ in stroma versus CD8+ in tumour *P = 0.0107 using a Kruskal–Wallis test with Dunn’s multiple comparison test). c,f, Representative intravital microscopic images (scale bars, 100 µm) and insets exemplifying 450 s motion tracks of Venus+ Pmel-1 CD8+ and eGFP+ TRP-1 CD4+ T cells at the stromal (S) and tumoural (T) area of the invasive tumour margin of CRISPR-ctrl (c) or Jak1-KO (f) melanomas. g, Experimental protocol to assess antigen-dependent interactions between eGFP+ TRP-1 CD4+ T cells and CD11c+ immune cells. h, Arrest coefficient, mean speed and relative contact duration between eGFP+ TRP-1 CD4+ T cells and CD11c-Venus cells (the bars indicate the median; 43–132 cells examined from three independent experiments; ****P < 0.0001, **P = 0.0022 with a Mann–Whitney U-test). i, Representative motion tracks of eGFP+ TRP-1 CD4+ T cells interacting with CD11c-Venus cells in CRISPR-ctrl and Trp1-KO melanomas. Scale bars, 20 µm. j, Experimental protocol to assess the impact of MHC-II blockade on antigen-dependent interactions between eGFP+ TRP-1 CD4+ T cells and CD11c+ immune cells. k, Arrest coefficient, mean speed and relative contact duration between eGFP+ TRP-1 CD4+ T cells and CD11c-Venus cells (the bars indicate the median; 203–273 cells examined from three independent experiments; ****P < 0.0001, ***P = 0.0003, with a Mann–Whitney U-test). l, Representative motion tracks of eGFP+ TRP-1 CD4+ T cells interacting with CD11c-Venus cells in CRISPR-ctrl Tyr-KO tumours with and without MHC-II blockade. Scale bars, 20 µm. Data were pooled from at least three independent mice and groups statistically compared using a one-way ANOVA with Tukey post hoc.

