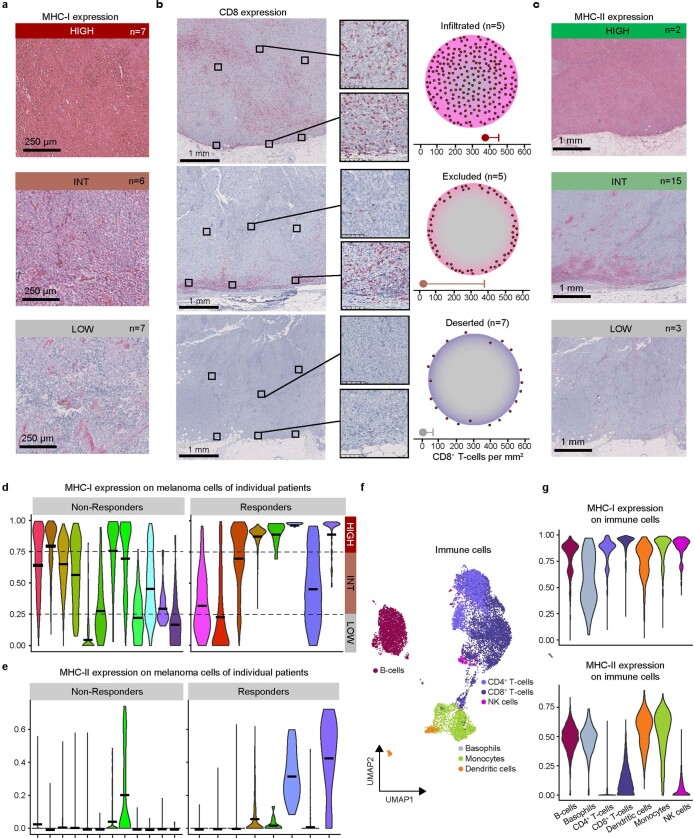
Extended Data Fig. 1. Landscapes of MHC expression, distribution of tumour infiltrating CD8+ T cells, and single cell transcriptomes of human melanoma metastases.
a, Representative immunohistochemical stains of human melanoma skin metastases with high, intermediate and low expression of MHC-I. b, Left: Overviews of representative immunohistochemistry stainings for CD8 and magnifications of 0.1 mm2 squares in the tumour center and at the tumour invasive margins that were evaluated for the number of infiltrating CD8+ T cells; Right: graphical illustration of the three distinct patterns of immune infiltration observed. c, Representative immunohistochemical stains of human melanoma skin metastases with high, intermediate and low expression of MHC-II. d, MHC-I and (e) MHC-II gene set expression in single melanoma cells of an additional set of human melanoma metastases in skin (n = 5), subcutis (n = 4), and lymph nodes (n = 11), categorised into ICB therapy responders and non-responders. Median MHC-I gene set expression was used to categorize tumours according to high (>0.75), intermediate (0.25 - 0.75) and low (<0.25) expression levels. f, Uniform manifold approximation and projection (UMAP) clustering of the immune cell compartment in human melanomas annotated as indicated. g, MHC-I (top) and MHC-II (bottom) gene set expression in the indicated immune cell subpopulations.

