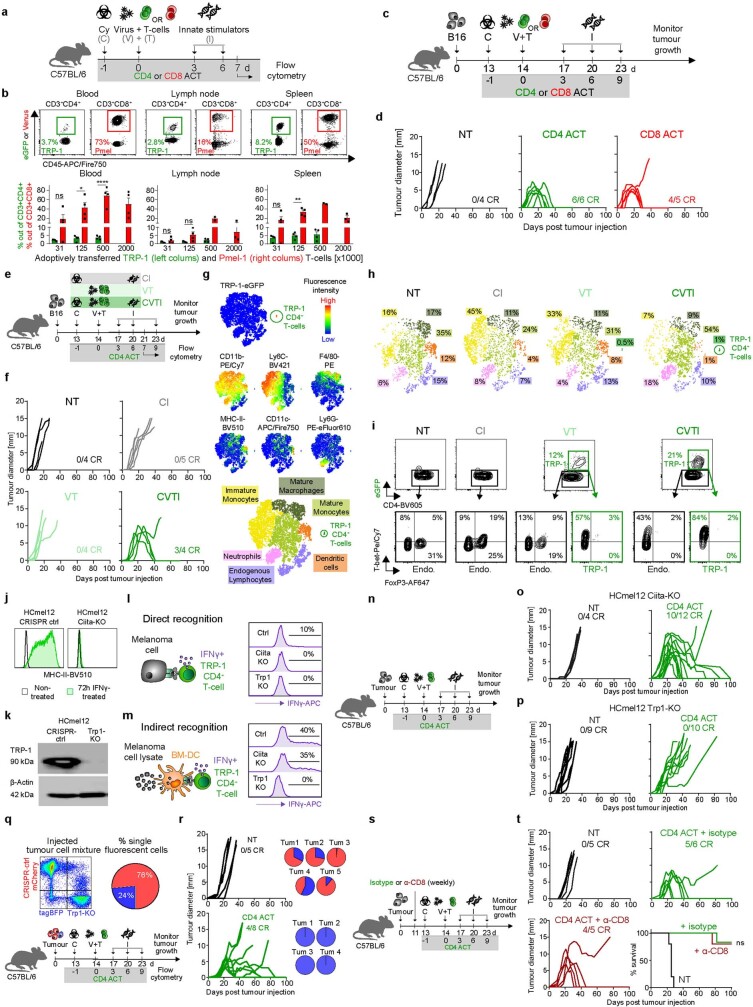
Extended Data Fig. 2. Establishment of an experimentally tractable adoptive cell transfer model to compare CD4+ and CD8+ T-cell effector functions against tumours and eradication of established MHC-II-deficient melanomas through indirect antigen recognition on MHC-II+ tumour-infiltrating immune cells.
a, Experimental protocol to assess the in vivo expansion of adoptively transferred CD8+ and CD4+ T cells. b, Representative flow cytometric contour plots with 0.5 x 10⁶ transferred cells (top) and quantitation of Pmel-1 CD8+ and TRP-1 CD4+ TCRtg T-cell expansion in peripheral blood, lymph nodes and spleen 7 days after ACT (bottom, mean ± SEM from n = 2-4 biologically independent samples; ****p < 0.0001, **p = 0.0010, *p = 0.0146 by one-way ANOVA with Tukey’s post-hoc test). c,e, Experimental protocols for adoptive cell transfer (ACT) immunotherapy of established tumours in mice and flow cytometric analyses of tumour-infiltrating immune cells. d,f, Individual tumour growth curves of established B16 melanomas treated as indicated. g, t-SNE heatmaps of multiparametric flow cytometry for B16 melanoma single cell suspensions showing the indicated markers (top) and corresponding annotation (bottom) of TRP-1 CD4+ T-cells (GFP+), immature monocytes (CD11b+ Ly6Chi), mature monocytes (CD11b+ Ly6Clo), mature macrophages (CD11b+ F4/80+), dendritic cells (CD11b+ MHC-II+ CD11c+), endogenous lymphocytes (CD11b- CD11c-), and neutrophils (CD11b+ Ly6G+). h, Annotated t-SNE plots quantifying the immune cell composition of B16 melanomas treated as indicated. i, Representative flow cytometric contour plots for the phenotyping of endogenous and transferred (VT, CVTI, green) CD4+ T-cells from mice treated as indicated. j, Representative flow cytometric histograms for MHC-II expression on indicated melanoma cells cultivated in the presence or absence of IFNγ. k, Representative western blot analysis for TRP-1 expression for the indicated melanoma cells (n = 2 biologically independent samples). Beta-actin was used as a loading control. For uncropped images see source data table. l, Graphical representation of direct and (m) indirect recognition of melanoma cells by CD4+ T-cells (left) and representative flow cytometry histograms showing IFNγ+ TRP-1 CD4+ T-cells following stimulation by the indicated melanoma cells (right). n, Experimental protocol and (o,p) individual tumour growth curves of established B16 melanomas treated as indicated. q, Injection of a tumour cell mixture consisting of ~75% HCmel12 CRISPR-ctrl cells and ~25% HCmel12 Trp1-KO cells (top) and treatment protocol (bottom). r, Individual tumour growth curves of mice bearing established melanomas and treated as indicated (left) and proportion of HCmel12 CRISPR-ctrl and HCmel12 Trp1-KO cells from escaping tumours (right). s, Experimental treatment protocol for depletion of CD8+ T-cells during CD4 ACT. t, Individual tumour growth curves and Kaplan-Meier survival graph of mice bearing established HCmel12 CRISPR-ctrl melanomas treated as indicated. Means between groups were statistically compared using one-way ANOVA with Tukey’s post-hoc test. Survival was statistically compared using a log-rank Mantel-Cox test. NT, non-treated; C, cyclophosphamide; V, Ad-PT; T, TCRtg TRP-1 CD4+ T-cells; I, innate stimuli, polyI:C and CpG; CR, complete responders.

