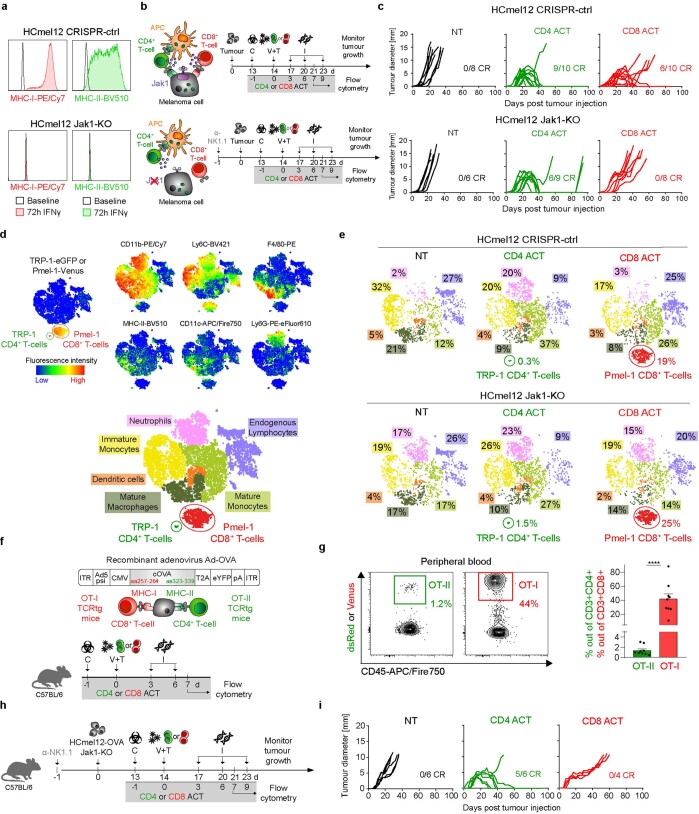
Extended Data Fig. 3. Comparative evaluation of CD4+ and CD8+ T-cell effector functions against IFN-unresponsive tumours lacking MHC-I and MHC-II.
a, Representative flow cytometric histograms for MHC-I and MHC-II expression of indicated melanoma cells in the presence or absence of IFNγ. b, Graphical representation of the interaction phenotype of the indicated melanoma cells (left) and experimental treatment protocol (right). c, Individual tumour growth curves of mice bearing established melanomas and treated as indicated. d, t-SNE heatmaps of multiparametric flow cytometry for HCmel12 melanoma single cell suspensions showing the indicated markers (top) and corresponding annotation (bottom) of TRP-1 CD4+ T-cells (GFP+), Pmel-1 CD8+ T-cells (Venus+), immature monocytes (CD11b+ Ly6Chi), mature monocytes (CD11b+ Ly6clo), mature macrophages (CD11b+ F4/80+), dendritic cells (CD11b+ MHC-II+ CD11c+ F4/80-), endogenous lymphocytes (CD11b- CD11c-), and neutrophils (CD11b+ Ly6G+). e, Quantification of the immune cell composition of HCmel12 CRISPR-ctrl and Jak1-KO tumours treated as indicated. f, Recombinant adenovirus Ad-OVA (top) and experimental protocol (bottom) to assess the in vivo expansion of adoptively transferred ovalbumin-specific CD8+ and CD4+ T-cells. g, Representative flow cytometric contour plots with 0.5 x 10⁶ transferred T-cells and quantitation of OT-I CD8+ and OT-II CD4+ TCRtg T-cell expansion in peripheral blood 7 days after ACT (mean ± SEM from n = 9 biologically independent samples, ****p < 0.0001 using a two-tailed paired t-test). h, Experimental protocol and (i) individual tumour growth curves of mice bearing established HCmel12-OVA Jak1-KO tumours, treated as indicated. Means between groups were statistically compared using a two-tailed paired t-test.

