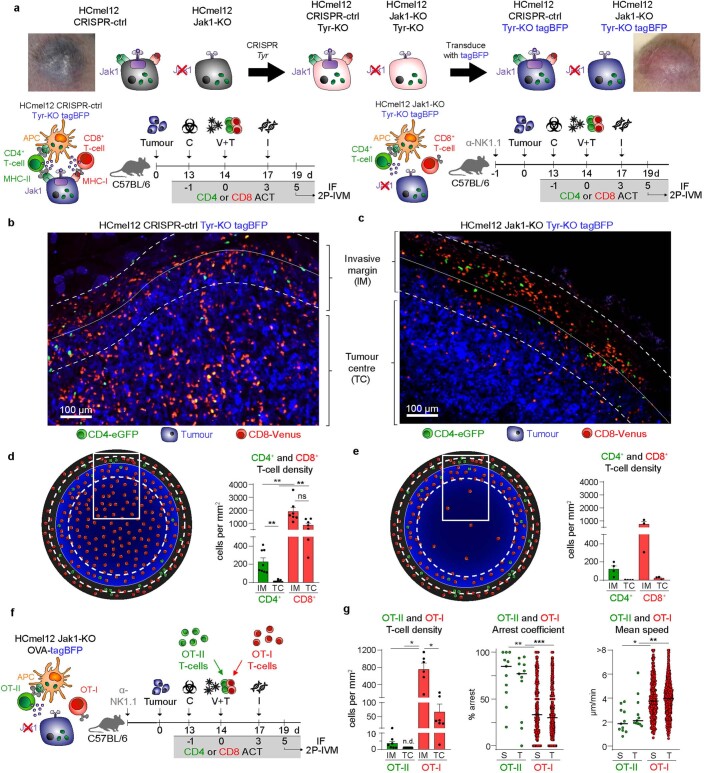
Extended Data Fig. 4. CD4+ effector T-cells show a different spatial distribution and migratory behaviour in tumour tissues when compared to CD8+ effector T-cells.
a, Macroscopic phenotype and graphical representation for the generation of amelanotic HCmel12 CRISPR-ctrl or Jak1-KO Tyr-KO tagBFP cell lines (top) and experimental treatment protocols (bottom). b,c, Representative fluorescence image for the distributions of Venus+ Pmel-1 CD8+ T-cells and eGFP+ TRP-1 CD4+ T-cells in indicated HCmel12 variants. d,e, Diagrammatic representation of the Venus+ Pmel-1 CD8+ T-cell and eGFP+ TRP-1 CD4+ T-cell distribution in a whole tumour cryosection of HCmel12 Tyr-KO CRISPR-ctrl (d) or Jak1-KO (e) melanomas (left) and corresponding quantitation (right) at the invasive margin (IM) and in the tumour centre (TC) (mean ± SEM for n = 6-7 biologically independent samples; CD4+ IM vs CD4+ TC **p = 0.0051, CD4+ IM vs CD8+ IM **p = 0.0035, CD4+ TC vs CD8+ TC **p = 0.068 using a one-way ANOVA with Tukey post-hoc). f, Diagrammatic representation and experimental protocol for treatment of HCmel12 Jak1-KO Tyr-KO OVA-tagBFP cells. g, Cell density (mean ± SEM from 7 biologically independent samples; CD4+ IM vs CD8 IM * p = 0.0122, CD4+ TC vs CD8+ IM * p = 0.0173, CD8 TC vs CD8 IM *p = 0.121 using a one-way ANOVA with Tukey post-hoc) at the IM and in the TC and arrest coefficient (***p = 0.0005, **p = 0.0046 using a Kruskal-Wallis test with Dunn’s multiple comparison test) and mean speed (**p = 0.0012, *p = 0.0499 using a Kruskal-Wallis test with Dunn’s multiple comparison test) of adoptively transferred of adoptively transferred Venus+ OT-I CD8+ and dsRed+ OT-II CD4+ T-cells in the stromal (S) and tumoural (T) compartment at the invasive margin (11-794 cells examined from 3 independent experiments; bar indicates the median).

