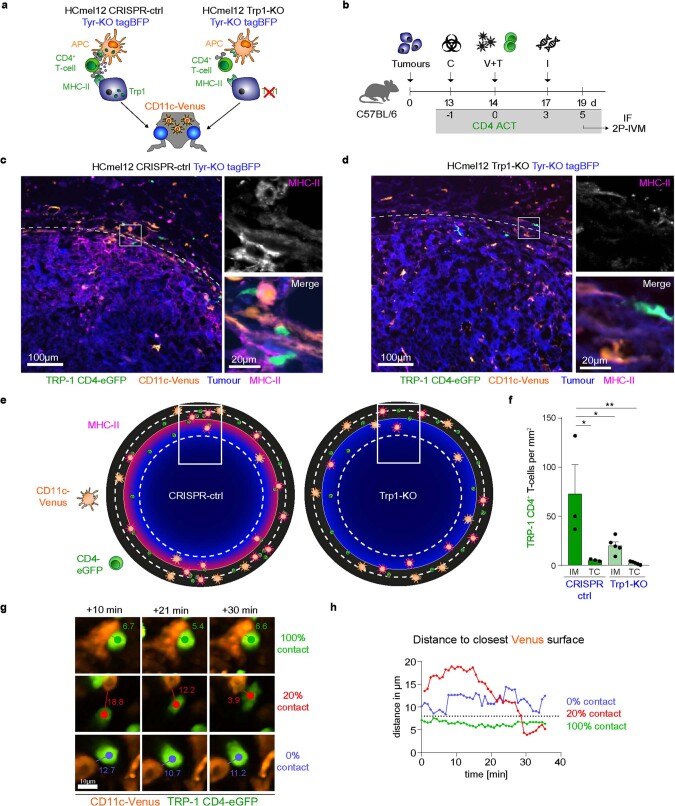
Extended Data Fig. 5. CD4+ effector T-cells cluster with MHC-II-expressing CD11c+ immune cells at the invasive margin of mouse melanomas.
a, Graphical representation of the interaction phenotype of the indicated HCmel12 variants and (b) experimental protocol to study antigen-specific interactions between eGFP+ TRP-1 CD4+ T-cells and CD11c+ cells in CD11c-Venus mice. c,d, Representative immunofluorescence images of MHC-II-stained cryosections from a (c) CRISPR-ctrl and a (d) Trp1-KO melanoma (mean ± SEM from n = 3-5 biologically independent samples). The dashed lines indicate the tumour border. e, Diagrammatic representation of MHC-II expression and interactions between eGFP+ TRP-1 CD4+ T-cells and CD11c-Venus antigen-presenting cells in CRISPR-ctrl and Trp1-KO melanomas. f, Density of eGFP+ TRP-1 CD4+ T-cells at the invasive margin (IM) and in the tumour centre (TC) of indicated tumours (mean ± SEM from n = 3-5 biologically independent samples, **p = 0.0037, CRISPR-ctrl IM vs Trp1-KO IM *p = 0.0267, CRISPR-ctrl IM vs TC *p = 0.0112). Means between groups were statistically compared using a one-way ANOVA with Tukey post-hoc. g,h Intravital 2P-microscopy images of three eGFP+ TRP-1 CD4+ T-cells and their distance to CD11c-Venus cells over time.

