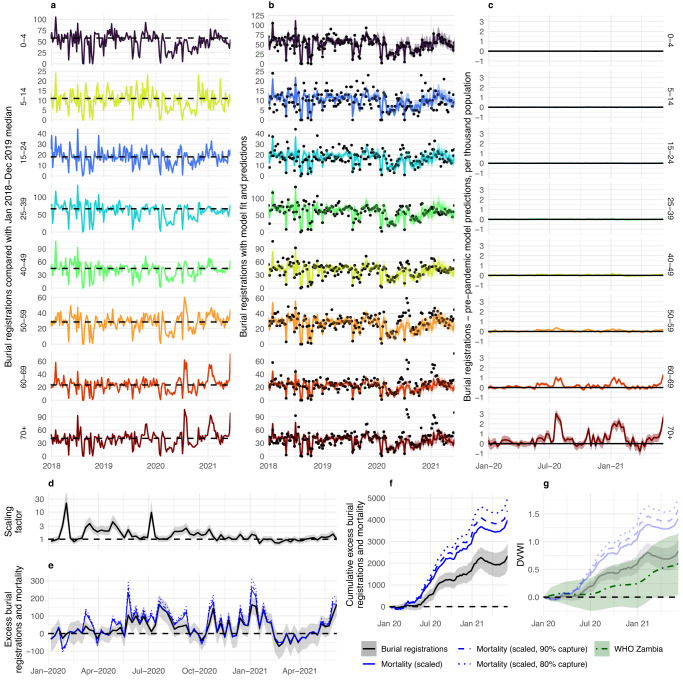
Fig. 4. Excess mortality in Lusaka.
Figure shows a burial registrations grouped by age with 2018–2019 median shown throughout (dotted line), b burial registrations (points) with model fit (line and ribbon) combining age-distribution of deaths with the number of registrations aged <5 fitted to 2018–2019 burial registrations and predictions of expected registration in 2020–2021, c excess burial registrations per thousand people based on the difference between total burial registrations and 2020-21 model predictions, d scaling factor based on burial registrations aged <5 relative to their pre-pandemic median, e application of scaling factor to excess burial registration of population aged 5+ (black) to estimate median excess mortality (blue) and with additional assumption of 90% and 80% registration capture of underlying mortality (blue, dashed and dotted lines), f cumulative estimates of excess burial registrations (black), median cumulative mortality assuming weekly scaling (blue), and median cumulative mortality assuming 90% and 80% registration capture of underlying mortality (blue, dashed and dotted), g demographic-vulnerability- weighted index (DVWI, the cumulative attack rate required to achieve excess burial registrations (black), or mortality assuming scaling (blue) with 100%, 90%, and 80% registration capture of underlying mortality registration (solid, dashed and dotted) in e, f or in World Health Organisation (WHO) excess mortality estimates for Zambia, assuming the overall IFR for Lusakan and Zambian population structures, respectively, and direct COVID-19 causation. In all model plots, lines and ribbons show the median and 95% credible interval. Registrations, mortality and DVWI are grouped by week in all panels.

