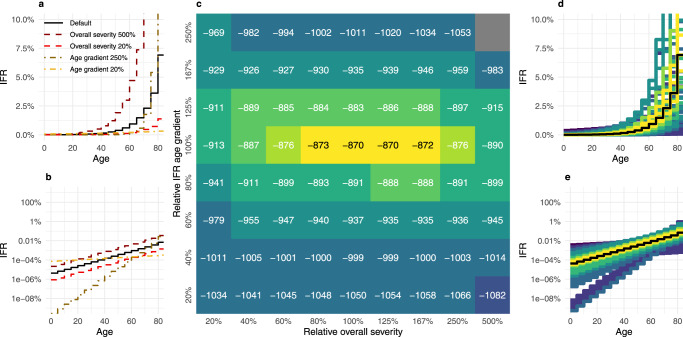
Fig. 6. Inference of age-gradient and scale of severity.
a, b are infographics to show how the infection fatality ratio (IFR) curve changes when the intercept or slope is altered on a standard and b log scales. Each plot shows the default IFR from Brazeau et al.42 as a solid line, with relative overall severities of 20% and 500% of those default values or relative age-gradient of 20% and 250% of the slope on the log scale, maintaining the overall severity of the default. The heatmap c shows the log of the average posterior model fit over 100 samples. d, e show all assessed IFR curves, coloured by posterior fit as found in c, and where default IFR assumptions are highlighted in black, plotted on d standard and e log scales.

