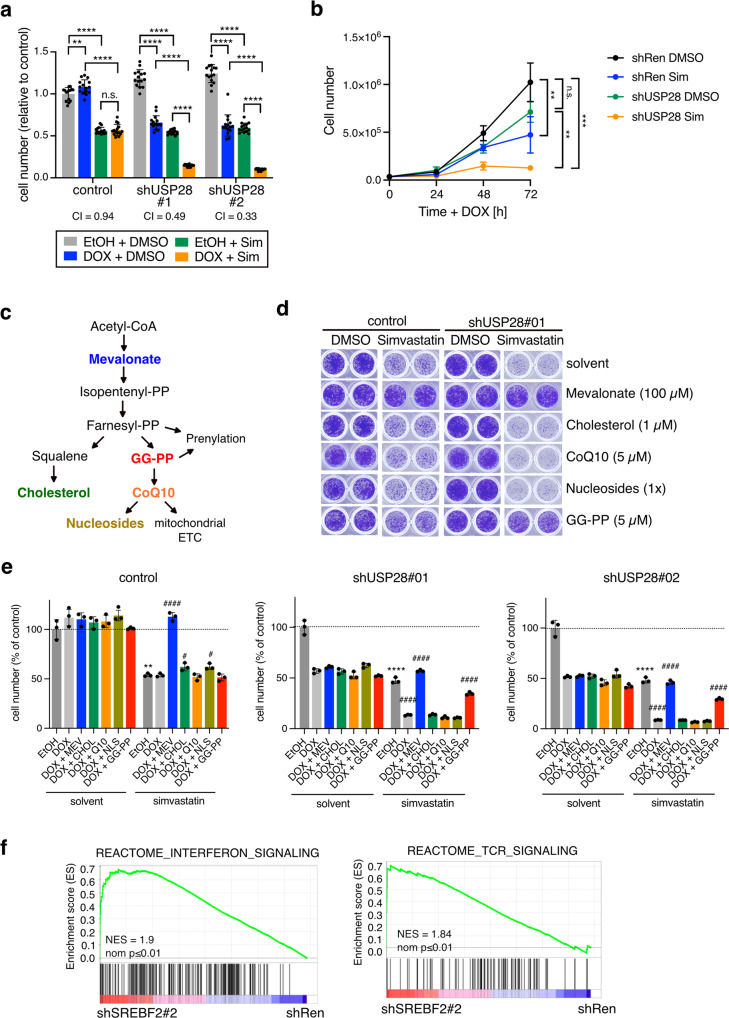
Fig. 4. Inhibition of USP28 and MVP synergise in reducing cell viability.
a A431 cells expressing inducible shRNAs targeting USP28 (shUSP28#1 or shUSP28#2) or control cells were treated with 1 µg/ml doxycycline (Dox) or solvent (ethanol, EtOH) for 72 h together with 10 µM simvastatin (Sim) or solvent (DMSO). Cell viability was determined by crystal violet staining. Data are presented as mean± SD of three independent experiments (n.s. non-significant, ****p < 0.00001, one-way ANOVA with post-hoc Tukey test). b Growth curves of shUSP28#1 or control (shRen) treated with 1 µg/ml doxycycline (Dox) or solvent (ethanol, EtOH) together with 10 µM simvastatin (Sim) or solvent (DMSO). Data are presented as mean± SD of three independent experiments (n.s. non-significant, *p < 0.05, ****p < 0.00001, one-way ANOVA with post-hoc Tukey test). c Schematic of the different metabolic outputs of the MVP. GG-PP = geranyl-geranyl-pyrophosphate, CoQ10 = ubiquinone. d Cells as in (a) were treated with 1 µg/ml doxycycline or solvent (ethanol, EtOH) for 72 h together with 10 µM simvastatin (Sim) or solvent (DMSO) plus the indicated compounds: 100 µM mevalonate, 1 µM cell-permeable cholesterol, 5 µM ubiquinone (CoQ10), nucleosides (30 µM C, G, A, U each; 10 µM T) or 5 µM GG-PP. Cell viability was determined by crystal violet staining. Representative images of three independent replicates are shown. e Quantitation of data shown in (d). Data are presented as mean± SD of three independent replicates (n.s. non-significant, **p < 0.01, ****p < 0.0001, unpaired two-tailed Student’s t-test between EtOH vs EtOH plus simvastatin; #p < 0.05, ####p < 0.0001, one-way ANOVA with post-hoc Dunnett’s test compared to DOX plus simvastatin). f GSEA enrichment plots for gene sets mapping to interferon and TCR signalling comparing cells depleted for SREBF2 (SREBF2#2) and control (shRen).

