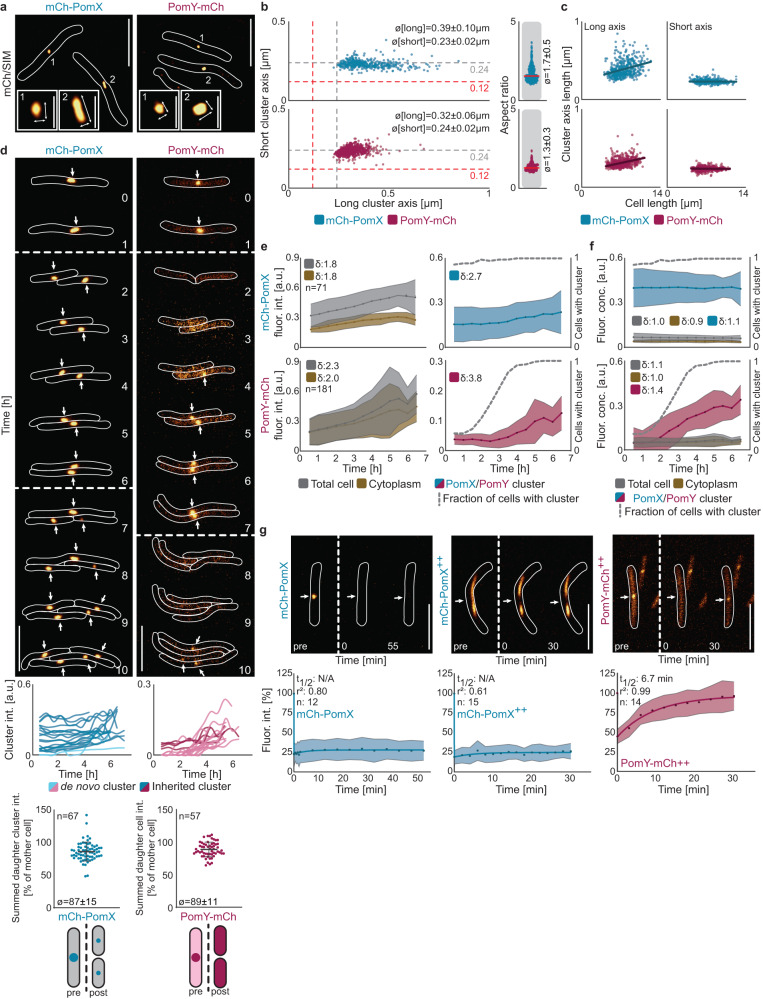
Fig. 1. PomX and PomY clusters are structurally flexible, non-stoichiometric and scale in size with cell size.
a SIM images of mCh-PomX or PomY-mCh clusters. Numbers indicate the insets and arrows the long and short cluster axes used for quantification. Scale bars, 5 µm, 0.5 µm in insets. b Quantification of cluster axes and cluster aspect ratios based on SIM images. Red and gray stippled lines in the left panels indicate the theoretical resolution of SIM and epifluorescence microscopy, respectively; red solid lines in right panels, median. n > 400 clusters in at least two independent replicates. ø, mean ± standard deviation (STDEV). c Quantification of cluster axes as function of cell length based on SIM images. Dark-colored lines indicate linear regression. Data as in (b). d Epifluorescence time-lapse microscopy of mCh-PomX or PomY-mCh clusters. Stippled lines, cell divisions. Arrows point to mCh-PomX and PomY-mCh clusters. Scale bars, 5 µm. Middle panels, quantification of mCh-PomX and PomY-mCh cluster intensity in 25 representative cells from birth to division. Dark-, and light-colored lines, intensity of clusters inherited from the mother and de novo synthesized, respectively. Lower panels, (left) quantification of mCh-PomX cluster fluorescence intensity pre- and post-division in mothers and their corresponding daughters; (right) quantification of total cellular PomY-mCh fluorescence intensity pre- and post-division in mothers and their corresponding daughters. n, number of divisions analyzed; error bars, mean ± STDEV. e Fluorescence intensity of mCh-PomX or PomY-mCh over the cell cycle. Colored dotted lines, mean and light-colored areas STDEV. δ-values, fold increase between birth and division. n, number of cells analyzed. f Fluorescence concentrations of mCh-PomX or PomY-mCh over the cell cycle. Same cells as in (e). g FRAP experiments. Cluster fluorescence intensity in a region of interest (ROI) of 0.52 µm in diameter before bleaching was set to 100%. Colored dots, mean and light-colored areas, STDEV. Dark lines, recovery fitted to a single exponential equation. ++, proteins were moderately overexpressed from the pilA promoter. Stippled lines, bleaching events marked by white arrows. n, number of bleaching events. Scale bars, 5 µm. Unless otherwise mentioned, mCh-PomX and PomY-mCh were expressed at native levels.

