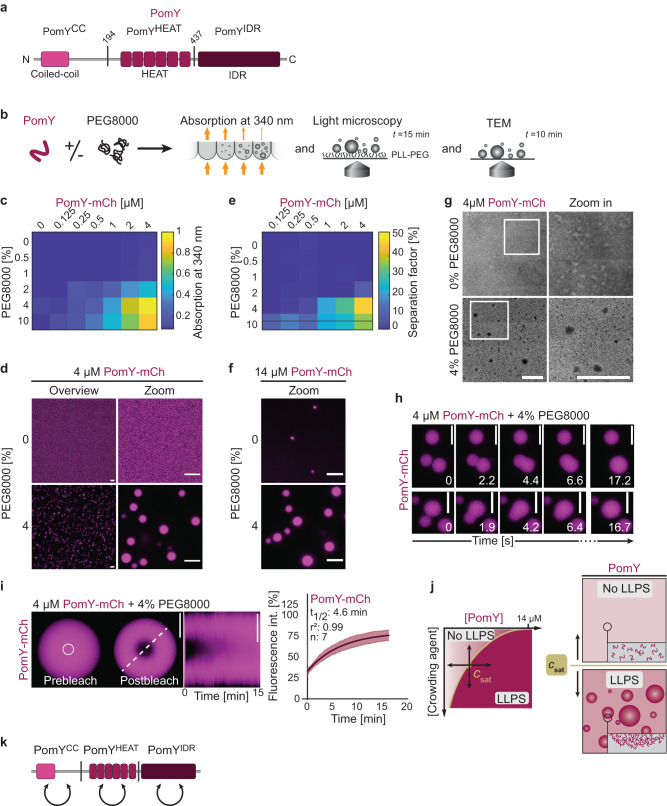
Fig. 3. PomY forms biomolecular condensates with liquid-like properties in vitro.
a Domain architecture of PomY. PomY domain truncations are indicated by vertical lines at the corresponding amino acid position. b Schematic of the experimental setup. c–f PomY phase separates in a protein and crowding-agent-dependent manner. c Turbidity measurements of PomY-mCh with increasing protein and PEG8000 concentrations. The heat map displays average absorption at 340 nm for n = 6 replicates. d Representative maximum intensity projections of confocal z-stacks (left) and high-resolution images (right) of 4 µM PomY-mCh in the absence and presence of 4% PEG8000. Scale bars, 5 µm. e Heat map of PomY-mCh phase separation with increasing protein and PEG8000 concentrations. Values are the average separation factor in percent calculated from the maximum intensity projection of confocal z-stacks. Data from two independent experiments with n = 8 analyzed images per condition. f Representative images of 14 µM PomY-mCh in the absence and presence of 4% PEG8000. Experiments were performed three times. Scale bars, 5 µm. g Representative TEM images of 4 µM PomY-mCh in the presence and absence of 4% PEG8000. Frames indicate regions in the zoomed images. Experiments were performed three times. Scale bars, 0.5 µm. h Time-series of PomY-mCh condensates undergoing fusion (4 µM PomY-mCh, 4% PEG8000). The experiment was performed five times. Scale bars, 5 µm. See Supplementary Movie 1. i Partial FRAP of PomY-mCh condensates (4 µM PomY-mCh, 4% PEG8000). Representative images of a PomY-mCh condensate before and after bleaching (white circle indicates ROI). Kymograph of the fluorescence recovery was created along the white stippled line. In the right diagram, the fluorescence intensity in the ROI was set to 100% before bleaching; the dark magenta line indicates the mean recovery fitted to a single exponential equation with the light-colored area showing the STDEV from n = 7 bleaching events. Scale bars, 5 µm. j Schematic representation of the phase separation behavior of PomY-mCh. Below Csat, PomY is homogeneously distributed, above Csat, PomY phase separates into a condensed phase. Csat can be surpassed by increasing the protein or the crowding agent concentration. k Schematic representation of the interactions between PomY domains as observed in BACTH analyses.

