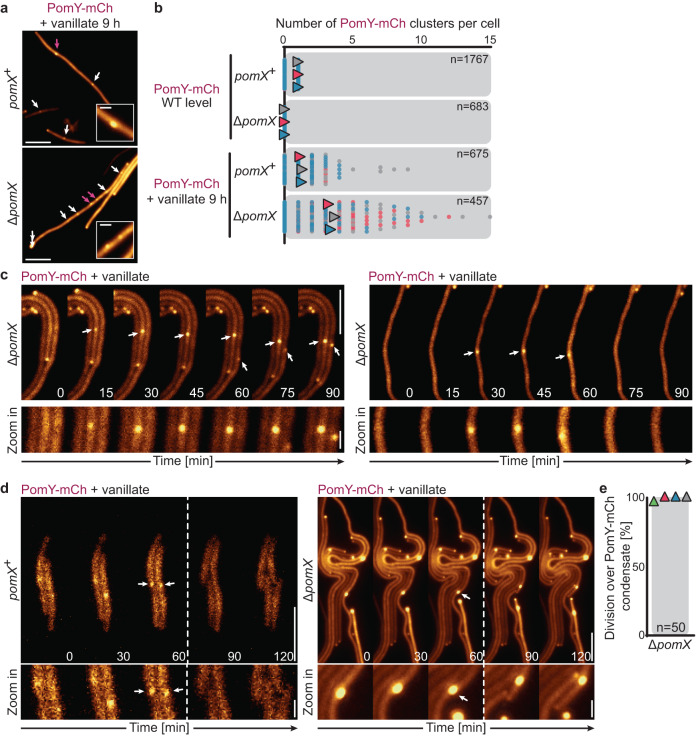
Fig. 5. PomY forms functional condensates in a concentration-dependent manner in vivo independently of PomX.
a Fluorescence microscopy of cells with a highly elevated PomY-mCh concentration after 9 h of induction with 1 mM vanillate. White arrows, PomY-mCh clusters; magenta arrows, clusters shown in insets. Scale bars, 5 µm and 0.5 µm in insets. b Quantification of the number of PomY-mCh clusters in cells in a and in cells accumulating PomY-mCh at native levels. Data from three replicates are shown in different colors and with triangles indicating the mean. For calculating the mean, only cells with clusters were included. n, number of cells analyzed. c Fluorescence time-lapse microscopy of cells with a highly elevated PomY-mCh concentration. Cells grown in suspension without vanillate were transferred to agarose pads containing 1 mM vanillate at 32 °C. Images show cells after ~10 h of induction. White arrows, cell regions with clusters shown in zoomed images. Scale bars, 5 µm, 0.5 µm in the zoomed images. The experiment was performed three times, and representative cells are shown. d Fluorescence time-lapse microscopy of cells with a highly elevated PomY-mCh concentration during division. Cells were treated as in (c). White arrows indicate regions with clusters immediately before cell division. Zoomed images show cluster regions during the cell division event. Stippled lines indicate cell division events. Scale bars, 5 µm and 0.5 µm in zoomed images. The experiments were performed three times (left panel) and four times (right panel) and representative cells are shown. e Quantification of cell divisions over PomY-mCh condensates. Experiments were performed as in (c). Data from four biological replicates are shown in different colors with triangles indicating the mean. Only cells with PomY-mCh condensates were used for the analysis. n, number of cell divisions analyzed.

