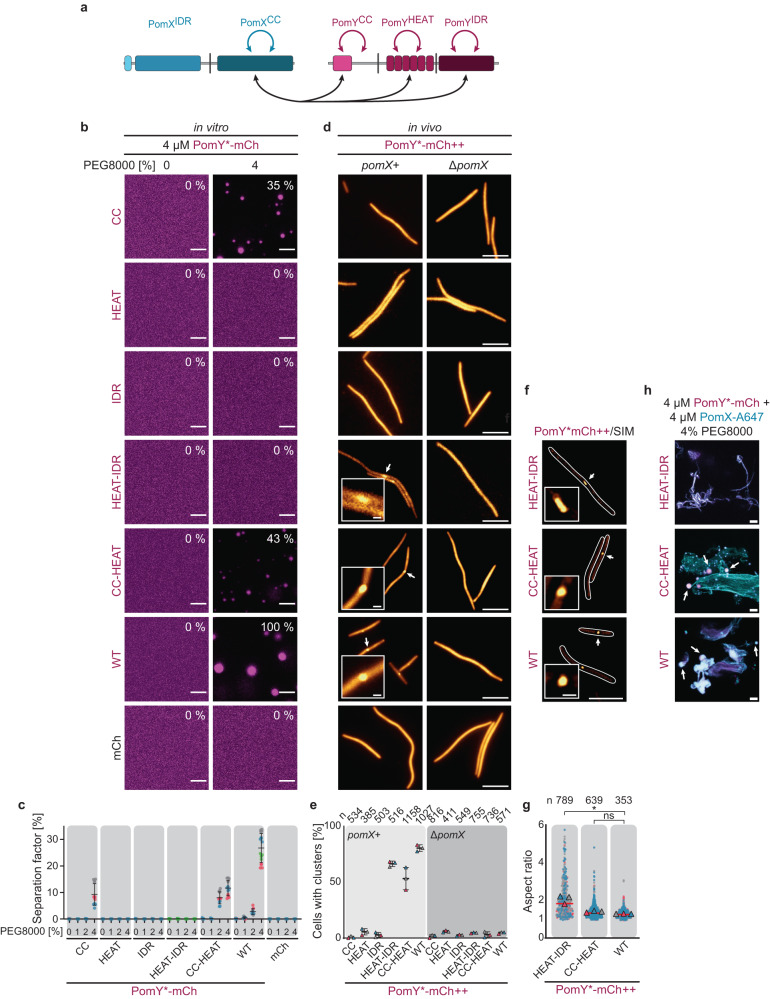
Fig. 6. Multivalent homotypic PomY interactions and multivalent heterotypic interactions with PomX are required for PomY condensate formation in vivo.
a Schematic of the interactions between PomX and PomY. Cyan, magenta and black arrows indicate interactions mapped in ref. 34, in the BACTH analysis and in the pull-down experiments, respectively. b, c PomYCC is required and sufficient for phase separation in vitro, while PomYHEAT and PomYIDR modulate phase separation. b Representative high-resolution images of PomY-mCh variants with or without 4% PEG8000 in vitro. The average separation factor in % normalized to that of PomY-mCh is indicated in the images and calculated from the maximum intensity projection of confocal z-stacks of the individual conditions. Scale bars, 5 µm. c Analysis of the separation factor of PomY-mCh variants in vitro in the presence of different PEG8000 concentrations. The average separation factor is calculated as in (b). Data from at least three independent experiments each shown as colored dots with n = 12 images per condition except nWT(4%PEG8000) = 16, nHEAT-IDR(2%PEG8000) = 10 and nHEAT-IDR(4%PEG8000) = 10. Error bars, mean ± STDEV. d Fluorescence microscopy of cells expressing the PomY-mCh variants in (b). Arrows, clusters shown in the insets. ++, PomY-mCh variants were expressed from pilA promoter. Scale bars, 5 µm, 0.5 µm in insets. e Percentage of cells in d with a cluster. Cells from three independent experiments with the mean shown as colored triangles, error bars, mean ± STDEV. f SIM images of cells expressing PomY-mCh variants as in (d). White arrows, clusters shown in the insets. Scale bars, 5 µm, 0.5 µm in inset. g Aspect ratio of clusters of the indicated PomY-mCh variants based on SIM images from (f). Measurements from three independent experiments are shown as colored dots together with the mean. Red line, the median. n, number of analyzed clusters. *, significant difference (P = 0.00005), ns, not significant (P = 0.2864) in two-way ANOVA test. h Representative maximum intensity projections of confocal z-stacks of indicated PomY-mCh variants mixed with PomX-A467 and 4% PEG8000 in vitro. Images show overlays of PomY-mCh (magenta) and PomX-A647 (cyan) images shown in Supplementary Fig. 11. White arrows, PomY*-mCh condensates. The experiment was performed three times. Scale bars, 5 µm.

