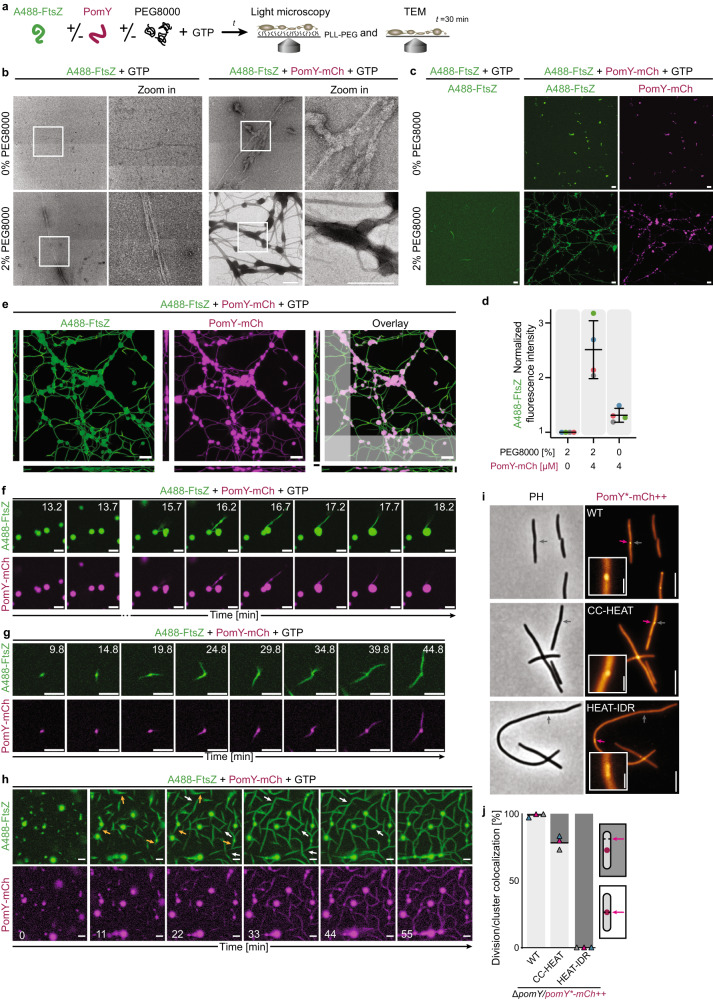
Fig. 8. PomY condensates nucleate GTP-dependent FtsZ polymerization and bundle FtsZ filaments.
a Experimental setup. b TEM images of 1 µM A488-FtsZ with 0.5 mM GTP with or without 4 µM PomY-mCh and/or 2% PEG8000. Frames, regions in zoomed images. Structures shown are rare except those formed in the presence of PomY-mCh and PEG8000. Experiments were performed three times. Scale bars, 0.5 µm. c Maximum intensity projections of confocal z-stacks of 1 µM A488-FtsZ with 0.5 mM GTP with or without 4 µM PomY-mCh and/or 2% PEG8000 at ~60 min incubation. The experiment was performed four times. Scale bars, 10 µm. d Average fluorescence intensity of A488-FtsZ from experiments in (c) normalized to that of A488-FtsZ in the absence of PomY-mCh and PEG8000. Data from four maximum intensity projections per condition shown as colored dots. Error bars, mean ± STDEV. e Maximum intensity and z-projection (of shaded areas) of a confocal z-stack (conditions and replicates as in (c). Scale bars, 10 µm. f, g Representative time-series acquired close to coverslip surface showing fusion of A488-FtsZ-enriched PomY-mCh condensates and sedimenting A488-FtsZ filament bundles (f) and the emergence of filamentous A488-FtsZ structures from a PomY-mCh condensate (g). Conditions as in (c). The experiment was performed four times. Scale bars, 5 µm. See Supplementary Movie 3. h Lower resolution time-series of a larger field of view showing the emergence of extended filament networks. A488-FtsZ filament bundles emerge from condensates (orange arrows) and fuse and align with each other (white arrows). Conditions as in (c). Scale bars, 5 µm. See Supplementary Movie 4. e–h Images gamma-corrected for visualization, unaltered images in Supplementary Fig. 14a–d. i Representative images of cells with cell division constrictions (gray arrows) and PomY*-mCh clusters (magenta arrow). ++ indicates expression from pilA promoter. Scale bars, 5 µm, 1 µm in insets. j Quantification of the colocalization of clusters of PomY*-mCh variants with division constrictions. Histogram, black lines indicate the mean of three independent experiments as in (i) shown as triangles in different colors. Light gray and dark gray, indicate constrictions colocalizing or not colocalizing with a PomY*-mCh cluster, respectively. n, 141, 102 and 18 (left to right).

