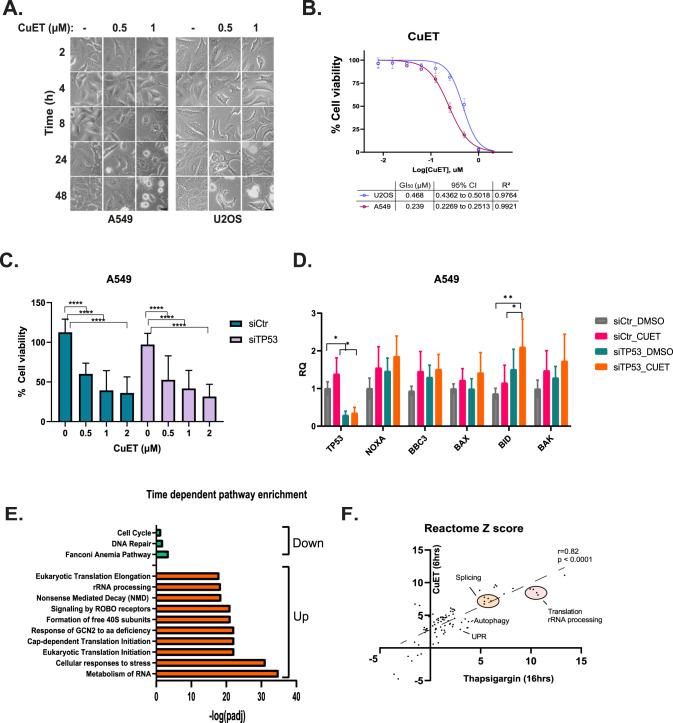
Fig. 4. CuET induces cell death in a p53-independent manner.
A. Representative light microscope images following treatment of A549 or U2OS cells with various concentrations of CuET for different time points. Scale bar: 10 μM. B CuET dose-response curves in A549 and U2OS cells. GI50 values are shown in the table with 95% confidence intervals, along with R2 values quantifying the goodness of fit (data are shown as mean ± SD, n = 3 biological replicates). C Cell survival analysis (resazurin) in A549 cells treated with siRNA against TP53 +/− various concentrations of CuET for 24 h. D Quantitative RT-PCR of various p53 targets in A549 cells treated with CuET (6 h) +/− siRNA against TP53 (data are shown as mean ± SD, n = 3 biological replicates, **p < 0.01, *p < 0.05, non-significant values are not shown). E Barplot of pathway enrichment terms (Reactome) for genes that are monotonically up-or down-regulated following CuET treatment. F Scatterplot depicting the correlation of Reactome terms among DE genes affected by CuET or thapsigargin.

