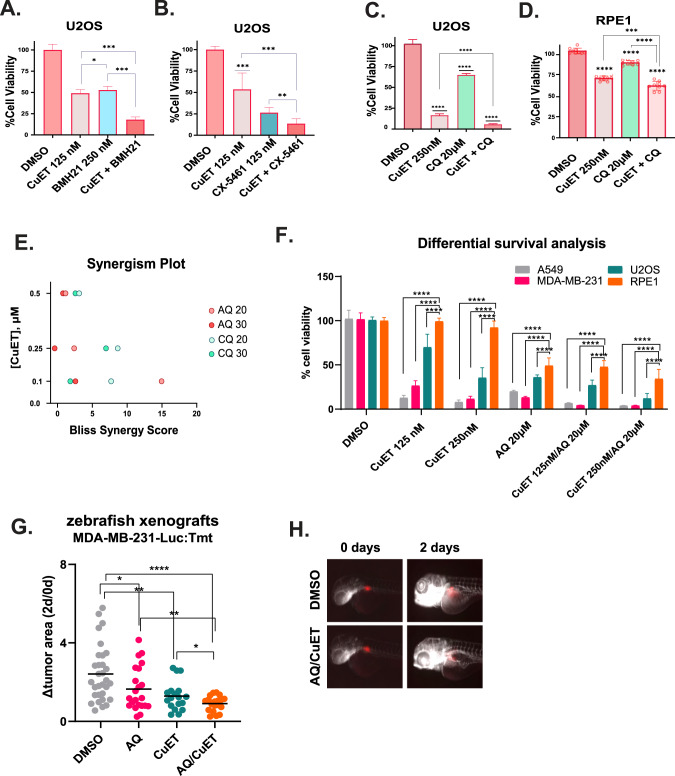
Fig. 5. RiBi and autophagy inhibition potentiate the cytotoxic effect of CuET.
A Survival analysis of U2OS cells treated with the synergistic pairs of CuET, BMH-21, or their combination (data are shown as mean ± SD, n = 3 biological replicates, ***p = 0.01, *p < 0.05). B Survival analysis of U2OS cells treated with the synergistic pairs of CuET, CX-5461, or their combination (data are shown as mean ± SD, n = 3 biological replicates, ***p = 0.01,**p < 0.01). C, D Survival analysis of U2OS (C) or RPE1 (D) cells treated with the synergistic pairs of CuET, chloroquine (CQ), or their combination (data are shown as mean ± SD, n = 3 biological replicates, ****p < 0.001, ***p = 0.01). E Comparative plot showing the Bliss synergy scores of the dose pairs tested among combinations of CuET/AQ (amodiaquine) and CuET/CQ. F Differential survival analysis between three cancer cell lines (A549, U2OS, MDA-MB-231) and RPE1 treated with CuET+/− AQ (data are shown as mean ± SD, n = 3 biological replicates, ****p < 0.001). G Quantification of the transplanted fluorescent tumor area in zebrafish xenografts treated with DMSO vehicle, AQ, CuET, or their combination for 48 h. The end-point signal (2 days) is normalized to the initial one (0 days) for each sample tested (Δtumor area). H Representative IF images of xenografts treated with DMSO or the combination of AQ/CuET. Tumors composed of transplanted MDA-MB-231 cells are shown in red.

