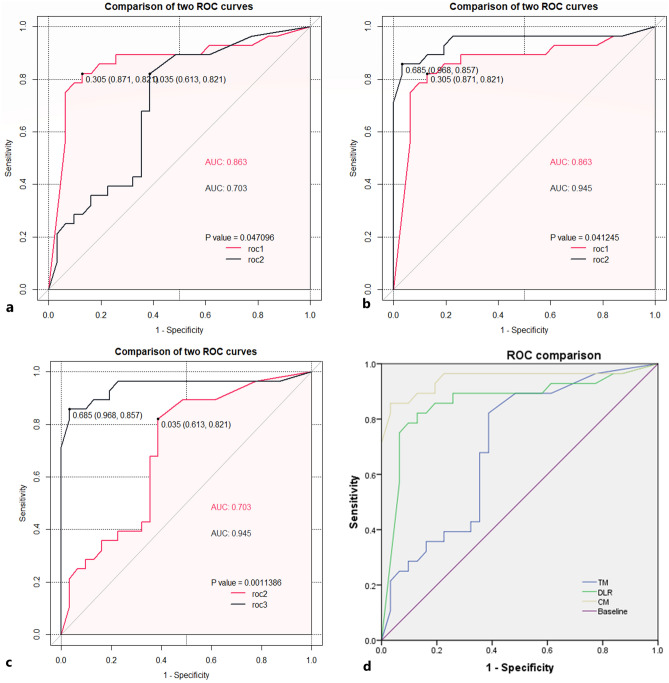
Figure 4.
Comparison of the ROC curves between the three models. (a) ROC comparison between traditional statistical model and DLR model, roc1 DLR model; roc2 traditional statistical models(TM), P < 0.05. (b) ROC comparison between combination model (CM) and DLR model, roc1 DLR model; roc2 combination model (CM), P < 0.05. (c) ROC comparison between combination model (CM) and traditional statistical models (TM), roc2 traditional statistical models (TM); roc3 combination model (CM), P < 0.05. (d) Comparison of ROC curves and AUC between the three models.

