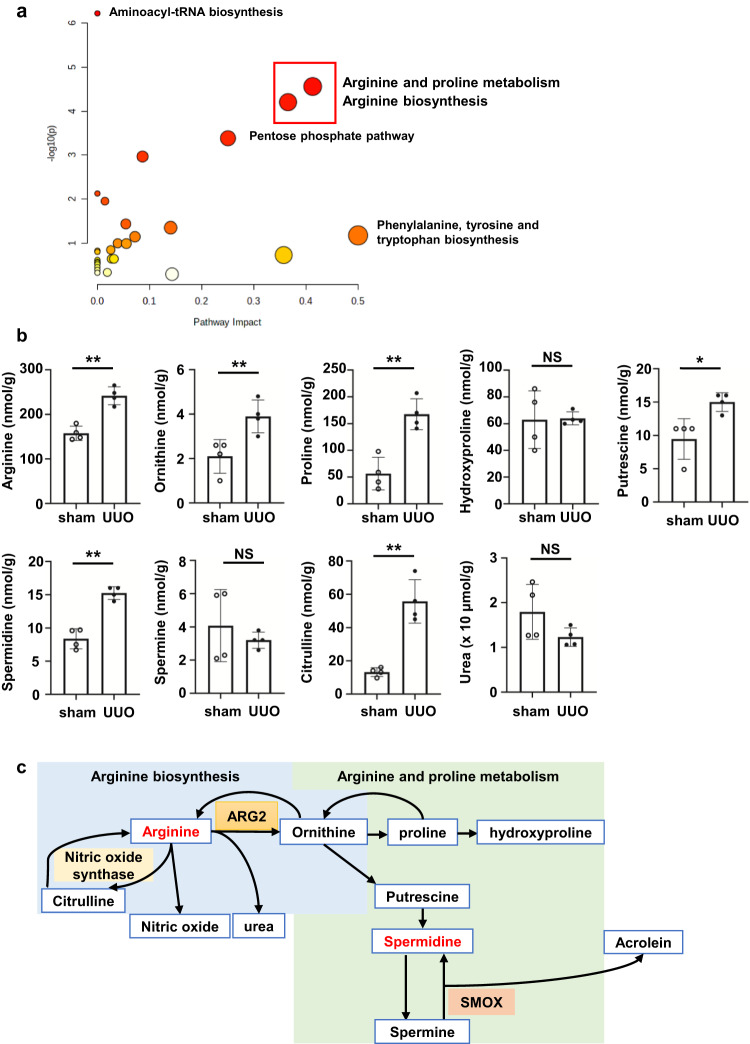
Fig. 1. Arginine metabolism is upregulated in the UUO kidney of mice.
a Results of pathway analysis using MetaboAnalyst. Of the 110 metabolites, pathway analysis was performed only for metabolites with a fold change of ≥1.5 in the UUO kidney relative to shams (n = 4 in each group). Red squares indicate “arginine and proline metabolism” and “arginine biosynthesis”. b Absolute quantitative values of metabolites related to arginine metabolites in the UUO kidney compared with those in shams (n = 4 in each group). Data are indicated as means ± SD. c Schematic diagram of “arginine biosynthesis” and “arginine and proline metabolism”. *P < 0.05, **P < 0.01. NS not significant, UUO unilateral ureteral obstruction, ARG2 arginase 2, SMOX spermine oxidase.

